vigil-log-relay: Kubernetes Log Collection Without a DaemonSet
Table of contents
Every team running workloads on Kubernetes eventually faces the same question: how do you get logs out of your pods and into your log aggregation stack? The standard answer is a DaemonSet. It works, but it comes with a cost. vigil-log-relay is a different answer.
The standard approach and its problems🔗
The textbook solution for Kubernetes log collection is a log agent running as a DaemonSet on every node — Fluent Bit, Promtail, Filebeat, or Fluentd. The agent reads log files directly from the node’s filesystem (/var/log/pods/…/*.log), enriches them with pod metadata from the Kubernetes API, and ships them downstream.
This works. But it comes with real operational weight:
Cluster-level RBAC. The DaemonSet ServiceAccount needs get/list/watch on pods and nodes across the whole cluster to enrich metadata. This is a broad grant — it sees metadata for every pod in every namespace.
Node-level access. Reading from /var/log/pods/ requires mounting a hostPath volume. This is a privilege that cluster administrators are (rightly) reluctant to hand out in multi-tenant clusters and OpenShift environments.
Cluster-admin involvement. Deploying a DaemonSet requires permissions that most application teams don’t have. Every change to the log agent — configuration update, version upgrade — is a cluster-level operation that needs a platform/ops team to execute it.
Resource contention. An agent running on every node consumes CPU and memory on every node, whether or not the node is running anything you care about.
One agent per node, not per namespace. You cannot easily run different log agents for different namespaces, or different filtering rules per team, without significant configuration complexity.
For many teams — especially those running on managed Kubernetes or OpenShift with restricted privileges — the DaemonSet model is simply not available.
What vigil-log-relay does instead🔗
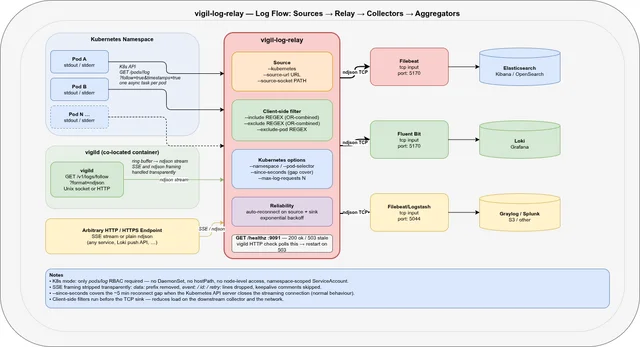
vigil-log-relay reads logs directly from the Kubernetes API (/api/v1/namespaces/<ns>/pods/<pod>/log?follow=true) and forwards them as ndjson to a TCP sink. It runs as a regular pod — not a DaemonSet, not a privileged container — and needs only a single RBAC permission:
rules:
  - apiGroups: [""]
    resources: ["pods", "pods/log"]
    verbs: ["get", "list", "watch"]
That’s it. No nodes access, no hostPath, no cluster-wide grant.
K8s API ──(one task per pod)──► vigil-log-relay ──► TCP :5170 ──► FilebeatThe relay watches the namespace for Running pods (event-driven, no polling), spawns an async log-streaming task per pod, and reconnects automatically when the Kubernetes API server closes the connection (which it does, every ~5 minutes, by design).
Three source modes🔗
vigil-log-relay is not a single-purpose tool. It supports three source modes that cover the full range of log collection scenarios you encounter with vigil-rs:
1. Kubernetes API (--kubernetes)🔗
Streams logs from all Running pods in a namespace via the Kubernetes API. Pod discovery is event-driven: new pods are picked up within seconds of starting; terminated pods are cleaned up automatically.
vigil-log-relay \
  --kubernetes \
  --namespace prod \
  --pod-selector app=myapp \
  --since-seconds 10 \
  --tcp-sink-host 127.0.0.1 \
  --tcp-sink-port 5170
--since-seconds 10 is the key to gap-free collection: on every reconnect (including the regular ~5-minute API-server-initiated ones), the relay asks for the last 10 seconds of logs. This overlaps with what was already forwarded and ensures nothing is lost in the gap. Duplicate lines from the overlap are handled downstream by the deduplication logic in your collector (or simply accepted — a 10-second overlap every 5 minutes is negligible).
2. HTTP / HTTPS URL (--source-url)🔗
Reads an ndjson or SSE stream from any HTTP/HTTPS endpoint. Both framing formats are handled transparently: SSE metadata lines (event:, id:, retry:, keepalive comments) are silently dropped; data: prefixes are stripped; plain ndjson lines pass through unchanged.
The primary use case is pulling from vigild’s own log stream:
vigil-log-relay \
  --source-url http://127.0.0.1:8080/v1/logs/follow?format=ndjson \
  --tcp-sink-host 127.0.0.1 \
  --tcp-sink-port 5170
This turns vigild’s ring-buffer log stream into a reliable TCP feed that any log collector can consume — without running curl as a persistent process.
3. Unix socket (--source-socket)🔗
Reads an HTTP stream from a Unix domain socket — specifically vigild’s socket. This is the most direct integration: the relay and vigild share a socket path inside the same container, no network involved.
vigil-log-relay \
  --source-socket /tmp/vigild.sock \
  --source-path "/v1/logs/follow?format=ndjson" \
  --tcp-sink-host 127.0.0.1 \
  --tcp-sink-port 5170
Useful when you want to collect logs from the supervised services of a specific vigild instance and forward them to a co-located Filebeat.
Filtering before forwarding🔗
Most log agents do filtering at the collector level — after the logs have already been forwarded. vigil-log-relay filters before sending to the TCP sink, reducing the load on the downstream collector and the network.
# Forward only ERROR and WARN lines
vigil-log-relay --kubernetes \
  --include 'ERROR|WARN' \
  --exclude '/healthz' \
  --exclude '/readyz'

# Multiple patterns are OR-combined
vigil-log-relay --kubernetes \
  --include 'error' \
  --include 'exception' \
  --include 'panic'
For Kubernetes mode you can also exclude entire pods by name regex:
# Skip job pods and debug pods
vigil-log-relay --kubernetes \
  --exclude-pod '^.*-job-[a-z0-9]+$' \
  --exclude-pod '^debug-'
And cap the number of concurrent pod streams to avoid overwhelming the Kubernetes API server in large namespaces:
vigil-log-relay --kubernetes \
  --max-log-requests 20
What existing log collectors cannot do here🔗
Let’s be specific. Filebeat, Fluent Bit, Promtail, and Vector are all excellent tools. But in this particular scenario — namespace-scoped log collection from a non-privileged pod without DaemonSet access — they all have gaps.
| Capability | Filebeat | Fluent Bit | Promtail | Vector | vigil-log-relay |
|---|---|---|---|---|---|
| Kubernetes log collection without DaemonSet | ❌ | ❌ | ❌ | ❌ | ✅ |
No hostPath volume required | ✅ (with K8s input) | ✅ (with K8s input) | ❌ | ✅ | ✅ |
| Namespace-scoped RBAC only | ❌ | ❌ | ❌ | ❌ | ✅ |
| Runs as non-privileged regular pod | ✅ | ✅ | ✅ | ✅ | ✅ |
| ndjson forwarding to TCP sink | ✅ | ✅ | ❌ | ✅ | ✅ |
| Read from vigild Unix socket | ❌ | ❌ | ❌ | ❌ | ✅ |
| Read SSE + ndjson transparently | ❌ | ❌ | ❌ | ❌ | ✅ |
| Client-side regex filter before TCP | ❌ | ❌ | ❌ | ❌ | ✅ |
| Pod-name exclusion regex | ❌ | ❌ | ❌ | ❌ | ✅ |
| Concurrent stream cap per relay | ❌ | ❌ | ❌ | ❌ | ✅ |
Built-in /healthz for supervisor | ❌ | ❌ | ❌ | ❌ | ✅ |
| Single static binary, ~5 MB | ❌ | ❌ | ❌ | ❌ | ✅ |
The first row is the critical one. Filebeat’s Kubernetes autodiscover, Fluent Bit’s Kubernetes filter, and Promtail’s Kubernetes service discovery all work by reading pod log files from the node filesystem. They do not call the Kubernetes log API directly for streaming. Without a DaemonSet or at least a privileged hostPath mount, they simply have no way to read the logs.
vigil-log-relay uses a fundamentally different mechanism: it calls GET /api/v1/namespaces/<ns>/pods/<pod>/log?follow=true×tamps=true for each running pod. This is a completely normal Kubernetes API call that any pod with the pods/log RBAC grant can make. No node access, no filesystem mounts, no privileges beyond what a typical application pod already has.
The role of /healthz🔗
vigil-log-relay exposes a built-in health endpoint (default 127.0.0.1:9091):
GET /healthz→200 okwhile the watch loop is tickingGET /healthz→503 staleif no tick has been received for more than--healthcheck-max-ageseconds (default 30 s)
This is designed to integrate directly with vigild’s HTTP health checks:
checks:
  relay-alive:
    level: alive
    startup: enabled
    delay: 40s       # one full cycle + margin before first check
    period: 30s
    timeout: 5s
    threshold: 2     # two consecutive 503s → restart
    http:
      url: http://127.0.0.1:9091/healthz
No shell script, no custom probe, no exec check. vigild polls the relay’s own liveness endpoint and restarts it if it goes stale — the same mechanism it uses for every other supervised service.
Running inside vigild🔗
The intended deployment is vigil-log-relay supervised by vigild, co-located with Filebeat in the same pod:
K8s API ──► vigil-log-relay ──► TCP 5170 ──► Filebeat ──► stdout ──► oc logs
                ↑                                 ↑
          vigild watches                    vigild watches
+ health check + health checkservices:
filebeat:
command: >-
sh -c 'mkdir -p /tmp/fb-data && filebeat run
--strict.perms=false --path.data /tmp/fb-data
-c /usr/share/filebeat/vigil-filebeat.yml 2>/dev/null'
startup: enabled
on-failure: restart
backoff-delay: 2s
backoff-limit: 30s
logs-forward: passthrough # enriched JSON → container stdout
relay:
command: /usr/local/bin/vigil-log-relay --kubernetes
startup: enabled
on-failure: restart
backoff-delay: 5s
backoff-limit: 60s
logs-forward: disabled # relay status → ring buffer, not stdout
on-check-failure:
relay-alive: restart
checks:
relay-alive:
level: alive
startup: enabled
delay: 40s
period: 30s
timeout: 5s
threshold: 2
http:
url: http://127.0.0.1:9091/healthzFilebeat and vigil-log-relay start independently. The relay reconnects to the TCP sink with exponential backoff — no after: filebeat ordering is needed.
Filebeat’s enriched ndjson output goes directly to container stdout via logs-forward: passthrough. The relay’s own status logs go into vigild’s ring buffer (logs-forward: disabled) and can be inspected without noise in container stdout:
kubectl exec <pod> -- vigil logs -f relayOpenShift compatibility🔗
OpenShift runs containers as a non-root random UID and applies additional security policies. The deployment adapts cleanly:
WORKDIR /tmp— world-writable, no root ownership required--socket /tmp/vigild.sock— avoids/run/which is root-owned at runtime--path.data /tmp/fb-data— Filebeat writes its registry to/tmp- No
hostPathmounts — nothing needs node-level access - Non-root ServiceAccount with namespace-scoped RBAC
We run this in production on OpenShift 4.x against a namespace with ~20 pods. The relay has been running for weeks without a single manual restart.
Running on a VM or bare metal (systemd)🔗
vigil-log-relay does not have to run inside Kubernetes. If your log aggregation pipeline runs on a VM — or if you want to collect logs from a remote namespace without deploying anything into it — you can run the relay as a regular systemd service. It uses the standard KUBECONFIG environment variable, so any valid kubeconfig works: a service-account token, an OIDC credential, or a client certificate.
The kubeconfig must point to a context where the service account has get, list, and watch on pods and pods/log in the target namespace. The same namespace-scoped RBAC rules apply regardless of where the relay runs.
# /etc/systemd/system/vigil-log-relay.service
[Unit]
Description=vigil-log-relay — Kubernetes namespace log collector
Documentation=https://github.com/git001/vigil-rs
After=network-online.target
Wants=network-online.target

[Service]
Type=simple
User=vigil-log-relay
Group=vigil-log-relay

# kubeconfig with namespace-scoped service account token
Environment=KUBECONFIG=/etc/vigil-log-relay/kubeconfig

ExecStart=/usr/local/bin/vigil-log-relay \
    --kubernetes \
    --namespace prod \
    --since-seconds 10 \
    --tcp-sink-host 10.4.5.6 \
    --tcp-sink-port 5170

# Restart on any non-zero exit: covers API errors, TCP sink unreachable, etc.
Restart=on-failure
RestartSec=5s
# Exponential backoff: 5 s → 10 s → 20 s … capped at 60 s
RestartSteps=4
RestartMaxDelaySec=60s

[Install]
WantedBy=multi-user.target
Health checking with a systemd timer🔗
systemd has no built-in HTTP health check. vigil-log-relay exposes GET /healthz on 127.0.0.1:9091 — a separate timer unit polls it every 30 seconds and restarts the service if it returns 503 stale:
# /etc/systemd/system/vigil-log-relay-healthcheck.service
[Unit]
Description=vigil-log-relay health check (oneshot)
After=vigil-log-relay.service

[Service]
Type=oneshot
ExecStart=/bin/sh -c \
    'curl -sf --max-time 5 http://127.0.0.1:9091/healthz || \
     systemctl restart vigil-log-relay.service'
# /etc/systemd/system/vigil-log-relay-healthcheck.timer
[Unit]
Description=Poll vigil-log-relay /healthz every 30 s
After=vigil-log-relay.service
[Timer]
# First check 45 s after boot — one full watch cycle + margin
OnBootSec=45s
OnUnitActiveSec=30s
[Install]
WantedBy=timers.target# Enable and start both units
systemctl daemon-reload
systemctl enable --now vigil-log-relay.service
systemctl enable --now vigil-log-relay-healthcheck.timer
# Inspect health
curl http://127.0.0.1:9091/healthz
journalctl -u vigil-log-relay -fThe timer fires 45 seconds after boot (giving the relay one full watch cycle to settle), then every 30 seconds. If /healthz returns 503 stale or the curl times out, systemctl restart brings the relay back. Combined with Restart=on-failure in the main unit, this gives two independent recovery paths: immediate restart on process crash, and a periodic liveness check for the case where the process is running but the watch loop has silently stalled.
What happens when the Kubernetes API closes the stream🔗
In production we consistently observed this pattern in the relay logs:
01:51:27 WARN log stream error pod=myapp-59467fcd98-gbtn5 error=ServiceError: error reading a body from connection
01:51:32 INFO starting log stream pod=myapp-59467fcd98-gbtn5
01:56:27 WARN log stream error pod=myapp-59467fcd98-gbtn5 error=ServiceError: error reading a body from connection
01:56:32 INFO starting log stream pod=myapp-59467fcd98-gbtn5The Kubernetes API server closes long-running streaming connections after its internal timeout — typically around 5 minutes. This is by design, not a bug. vigil-log-relay reconnects automatically with --since-seconds 10 to cover the gap. The warn log is expected and can be excluded from alerting.
The reconnect overhead is negligible: one lightweight HTTP request per pod per reconnect, far less traffic than the continuous log stream itself.
Getting started🔗
The binary is available in the vigil-rs v2.0.0 release.
The Kubernetes example at examples/kubernetes-pod-logs/ includes a full Deployment, ServiceAccount, ClusterRole, and ClusterRoleBinding — ready to apply with kubectl or oc.
# Build from source
cargo build --release --bin vigil-log-relay

# Watch all pods in namespace "prod", forward to local Filebeat
vigil-log-relay \
  --kubernetes \
  --namespace prod \
  --since-seconds 10 \
  --tcp-sink-host 127.0.0.1 \
  --tcp-sink-port 5170

# Filter: only ERROR and WARN, skip health check noise
vigil-log-relay \
  --kubernetes \
  --namespace prod \
  --include 'ERROR|WARN' \
  --exclude '/healthz' \
  --exclude '/readyz'

# Check health
curl http://127.0.0.1:9091/healthz
vigil-log-relay is part of vigil-rs, dual-licensed under AGPL-3.0 (open-source / internal use) and a commercial license for closed-source products.