
AWS vs. GCP vs. Azure vs. OVHcloud: Log Archiving Operations
Table of contents
This post covers the operational dimension of the managed log archiving comparison: how each provider integrates with Kubernetes, what ingest pipeline options exist, how backup and disaster recovery work, and how you observe the log pipeline itself.
- Part 1 — Overview & Cost: Services, storage model, 7-year cost comparison
- Part 2 — Pre-Flight, Flexibility & Auditor Export: Pre-flight checklist, retroactive flexibility, auditor export
- Part 3 — Operations — this post: Kubernetes integration, ingest pipeline, backup & DR, observability
- Part 4 — Security & Compliance: IAM/RBAC, encryption, WORM, GDPR, compliance certificates
- Part 5 — Query, Dashboards & Recommendations: Query interfaces, dashboards, alerting, cold-tier behaviour, when to use which
- Part 6 — Production Checklist, Guardrails & Runbooks: Loss detection, privacy, schema, cost guardrails, runbooks, fire drills
Self-hosted alternative: Elasticsearch vs. OpenSearch vs. Loki vs. Quickwit vs. ClickHouse — Part 2 (Operations)
Managed Kubernetes log collection addons, default agent versions, and observability features evolve rapidly across cloud providers and Kubernetes releases. Always verify current addon behaviour, support status, and default configuration against the provider’s official documentation before relying on the details below.
Kubernetes Integration🔗
The most common Kubernetes log collection pattern is a DaemonSet that reads container stdout/stderr from the node’s /var/log/containers/ path and ships them to the target. Each provider has a first-party agent and typically also supports Fluent Bit and OpenTelemetry Collector as community-supported alternatives.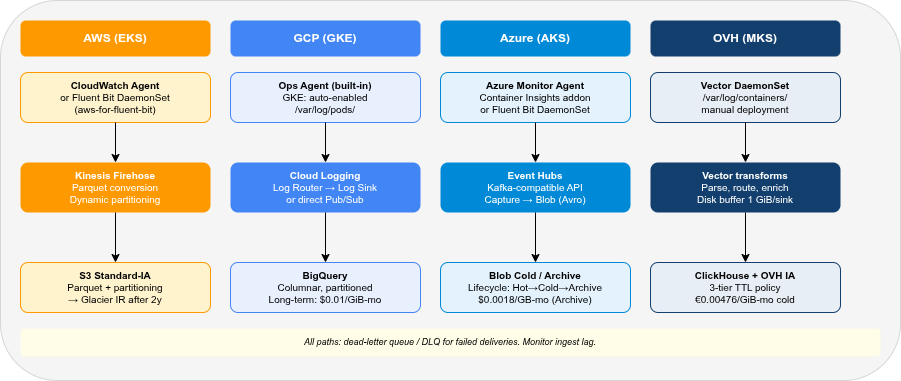
| AWS | GCP | Azure | OVH | |
|---|---|---|---|---|
| First-party DaemonSet agent | CloudWatch Agent | GKE managed logging agent | Azure Monitor Agent | None |
| Fluent Bit support | ✓ (aws-for-fluent-bit image) | ✓ | ✓ | ✓ |
| OpenTelemetry Collector | ✓ (ADOT) | ✓ | ✓ | ✓ |
| Vector DaemonSet | ✓ | ✓ | ✓ | ✓ (recommended) |
| Auto-collection on managed K8s | Partial (EKS: addon) | ✓ (GKE: enabled by default) | ✓ (AKS: addon) | ✗ (manual) |
| Agent-free serverless log capture | ✓ (Lambda, ECS Fargate) | ✓ (Cloud Run, GCF) | ✓ (Azure Functions, ACA) | ✗ |
AWS (EKS)🔗
AWS does not collect logs from EKS pods by default. You must deploy one of:
CloudWatch Agent via the EKS add-on: installs the CloudWatch Container Insights agent as a DaemonSet. Collects pod logs, metrics, and traces. Configuration via ConfigMap. The agent supports structured JSON parsing and automatic Kubernetes metadata enrichment.
# EKS add-on deployment
aws eks create-addon \
  --cluster-name my-cluster \
  --addon-name amazon-cloudwatch-observability \
  --region eu-central-1
Fluent Bit (aws-for-fluent-bit): AWS maintains a Fluent Bit image with pre-built outputs for CloudWatch Logs, Kinesis Firehose, and Kinesis Data Streams. The DaemonSet is Helm-deployable. Output to Firehose (for S3 archiving) is the cheapest option — bypasses CloudWatch Logs ingest cost entirely.
# values.yaml snippet: output to Firehose (bypasses CloudWatch)
firehose:
  enabled: true
  region: eu-central-1
  deliveryStream: my-log-stream
cloudWatch:
  enabled: false
Vector DaemonSet: Reads from /var/log/containers/, parses Kubernetes metadata, routes to Kinesis Firehose or directly to S3. Vector provides a kubernetes_logs source and dedicated aws_kinesis_firehose / aws_s3 sinks — see the official docs for a complete EKS setup.
GCP (GKE)🔗
GKE enables Cloud Logging collection by default. The Google-managed logging agent runs on GKE nodes when the “Cloud Logging” system component is enabled. No custom DaemonSet deployment is required for standard pod stdout/stderr collection.
# Enable Cloud Logging on GKE cluster (default: enabled)
gcloud container clusters update my-cluster \
  --logging=SYSTEM,WORKLOAD \
  --region europe-west3
Structured JSON logs written to stdout are automatically parsed by the managed logging agent. The log_name field routes logs to Cloud Logging; the jsonPayload becomes queryable as structured fields in Log Analytics.
For the bypass path (Pub/Sub → BigQuery), add a Log Sink to route logs from Cloud Logging to Pub/Sub — or deploy Fluent Bit / Vector as a DaemonSet and bypass Cloud Logging entirely:
# gcloud Log Sink: route all container logs to Pub/Sub
gcloud logging sinks create k8s-archive \
  pubsub.googleapis.com/projects/my-project/topics/log-archive \
  --log-filter='resource.type="k8s_container"'
Azure (AKS)🔗
AKS can automatically deploy the Azure Monitor Agent (AMA) as a DaemonSet via the Container Insights addon:
az aks enable-addons \
  --resource-group my-rg \
  --name my-cluster \
  --addons monitoring \
  --workspace-resource-id /subscriptions/.../workspaces/my-log-analytics
AMA collects pod logs, node metrics, and Kubernetes events. Log ingestion goes to the Log Analytics Workspace, where it is indexed and immediately queryable via KQL. The Container Insights addon installs a ConfigMap-driven Fluent Bit instance alongside AMA for custom log routing.
For the bypass path (Event Hubs → Blob Storage), deploy Fluent Bit with the Azure Event Hubs output plugin or Vector with the azure_event_hub sink.
OVH (OVH MKS)🔗
OVH Managed Kubernetes Service (MKS) has no built-in log collection. Deploy Fluent Bit or Vector as a DaemonSet manually.
LDP path (Fluent Bit → GELF): OVH LDP ingests via the GELF protocol over TLS (graX.logs.ovh.com:12202), authenticated with an X-OVH-TOKEN header (OVH docs).
# Fluent Bit Helm values (LDP path — simplified)
config:
  filters: |
    [FILTER]
        Name          record_modifier
        Match         kube.*
        Record        X-OVH-TOKEN ${LDP_TOKEN}
  outputs: |
    [OUTPUT]
        Name                  gelf
        Match                 kube.*
        Host                  graX.logs.ovh.com
        Port                  12202
        Mode                  tls
        Gelf_Short_Message_Key log
Self-hosted path (Vector → ClickHouse): detailed in Part 5 of the self-hosted series.
Ingest Pipeline Options🔗
| AWS | GCP | Azure | OVH | |
|---|---|---|---|---|
| Managed streaming ingest | Kinesis Data Firehose | Pub/Sub | Event Hubs | — (Vector/Fluent Bit DaemonSet) |
| Batch export from log service | CloudWatch → S3 export | Log Sink → GCS/BQ | Diagnostic Settings → Blob | — |
| Schema-on-read (raw JSON) | ✓ (Athena, OpenSearch) | ✓ (BigQuery) | ✓ (ADX, Synapse) | ✓ (ClickHouse JSON type) |
| Schema-on-write (defined columns) | ✓ (Parquet via Firehose) | ✓ (BigQuery schema) | ✓ (ADX tables) | ✓ (ClickHouse CREATE TABLE) |
| Built-in log transformation | Kinesis Firehose Lambda | Cloud Dataflow | Azure Stream Analytics | — (Vector VRL) |
| Kafka-compatible interface | Kinesis (partial) | ✗ | Event Hubs (✓ full Kafka API) | ✗ |
Kinesis Data Firehose supports inline data transformation via Lambda functions, automatic format conversion to Parquet or ORC, compression (GZIP, Snappy, ZSTD), and dynamic partitioning by custom fields — all before writing to S3. Dynamic partitioning on namespace, service, and date reduces Athena scan costs by confining queries to relevant partitions.
Cloud Pub/Sub + Dataflow: Pub/Sub is the streaming backbone; Dataflow (or Dataflow Flex Templates) handles transformation and writing to BigQuery. The Cloud Logging Log Sink can write directly to Pub/Sub without Dataflow for simple pipelines.
Azure Event Hubs exposes a full Kafka-compatible API, making it the easiest drop-in replacement for Kafka in Azure pipelines. Capture to Azure Blob Storage (Avro format) is a first-class feature of Event Hubs Standard and Premium tiers.
Backup & Disaster Recovery🔗
| AWS | GCP | Azure | OVH | |
|---|---|---|---|---|
| Object storage geo-replication | S3 Cross-Region Replication | GCS multi-region / dual-region | LRS / ZRS / GRS / RA-GRS | OVH Async Replication (same project only) |
| Log service native DR | CloudWatch: multi-AZ by default | Cloud Logging: regional buckets, Google-managed multi-zone durability | Azure Monitor: ZRS available | — (self-hosted ClickHouse: DR must be implemented manually) |
| RPO | Near-zero (async replication) | Near-zero | Near-zero (GRS) | No RPO SLA (async) |
| RTO (object storage restore) | Minutes | Minutes | Minutes | Minutes |
| RTO (log service restore) | N/A (always-on) | N/A (always-on) | N/A (always-on) | Service restart: ~minutes |
AWS🔗
For the S3 archival path, enable S3 Cross-Region Replication from the primary archival bucket to a backup bucket in a second EU region (e.g., eu-central-1 → eu-west-1):
{
  "Rules": [{
    "Status": "Enabled",
    "Destination": {
      "Bucket": "arn:aws:s3:::my-log-archive-backup",
      "StorageClass": "STANDARD_IA"
    }
  }]
}
CloudWatch Logs data is managed by AWS and replicated within the region automatically. There is no cross-region CloudWatch Logs replication — for DR, rely on the S3 export.
For OpenSearch Service, automated snapshots to S3 are enabled by default (daily). Manual snapshots can be triggered via the _snapshot API. Cross-cluster replication (CCR) is available for active-active setups between two OpenSearch Service domains.
GCP🔗
Cloud Logging data is stored in the _Default bucket with automatic multi-zone redundancy. For DR, the Log Sink export to a GCS dual-region bucket (e.g., eur4 — Finland + Netherlands) ensures data survives a single-region failure. Dual-region GCS costs more (~$0.044/GiB-month for Standard) but provides an RPO of near-zero.
BigQuery datasets are replicated within the multi-region (EU) or dual-region automatically. For cross-project or cross-org DR, use scheduled BigQuery exports to GCS.
Azure🔗
Azure Monitor Logs supports zone-redundant storage (ZRS) at workspace creation. For cross-region DR, the Data Export feature (preview/GA depending on region) replicates Log Analytics Workspace data to an Azure Storage Account in a secondary region.
For Blob Storage, Geo-Redundant Storage (GRS) or Read-Access GRS (RA-GRS) provides cross-region replication with a secondary read endpoint in the paired region (e.g., West Europe → North Europe).
OVH🔗
OVH Async Replication requires:
- Versioning enabled on both source and destination buckets
- Both buckets in the same OVH Public Cloud project (cross-project not supported)
- Pre-existing objects require a separate Batch Replication job
- Delete markers are not replicated by default (prevents accidental deletion propagating)
OVH Async Replication is best-effort with no documented RPO guarantee. For strict compliance requirements (e.g., RTO < 4 hours), plan additional copies or use a secondary Object Storage region with a separate ingest path.
Observability of the Log Pipeline🔗
A log pipeline that silently drops events is worse than no pipeline. Each provider offers different tools for monitoring the pipeline itself.
| AWS | GCP | Azure | OVH | |
|---|---|---|---|---|
| Ingest agent metrics | CloudWatch Agent → CW Metrics | GKE logging agent → Cloud Monitoring | AMA → Azure Monitor Metrics | Vector → Prometheus/Grafana |
| Delivery failure alerting | Firehose → CloudWatch → Alarm | Pub/Sub dead-letter topic | Event Hubs → Azure Monitor Alert | Vector sink error metrics |
| Dead-letter queue | ✓ (Firehose S3 error output) | ✓ (Pub/Sub DLQ) | ✗ (consumer replay via offsets — no native DLQ) | ✓ (Vector .dropped output) |
| End-to-end latency monitoring | Firehose delivery latency metric | Pub/Sub oldest_unacked_message_age | Event Hubs incoming vs. outgoing lag | Vector component_sent_bytes_total |
The most important metric to monitor in any log archiving pipeline is ingest lag — the age of the oldest message waiting to be delivered. If the ingest agent is writing faster than the destination can accept, the buffer fills and events start dropping.
For AWS Firehose, the DeliveryToS3.DataFreshness metric measures the age of the oldest record in Firehose that has not yet been delivered. Set a CloudWatch alarm at >5 minutes.
For GCP Pub/Sub, subscription/oldest_unacked_message_age is the equivalent. A subscription that grows stale indicates a consumer problem (Dataflow job crashed, BigQuery write quota hit).
For Vector DaemonSets (relevant for OVH self-hosted and bypass paths), export the vector_buffer_events_total{component_type="sink"} Prometheus metric and alert on sustained high buffer levels.
OVH has no built-in log pipeline observability. There is no managed equivalent to CloudWatch Alarms, Pub/Sub dead-letter topics, or Event Hubs metrics. All pipeline monitoring must be wired up manually: deploy a Prometheus + Grafana stack, scrape Vector’s metrics endpoint, and configure alerts on buffer levels and sink error rates.
Buffering & Backpressure🔗
When a log destination becomes slow or unavailable, the ingest agent must buffer events somewhere. Where that buffer lives — and whether it survives a process or node restart — determines whether you lose logs or just delay them.
| AWS | GCP | Azure | OVH | |
|---|---|---|---|---|
| Managed durable buffer | Kinesis Firehose (S3-backed, 24h) | Pub/Sub (up to 7 days) | Event Hubs (1–90 days) | — (self-managed) |
| Agent default buffer | In-memory (CloudWatch Agent) | In-memory (Fluent Bit) | In-memory (AMA) | Configurable (Vector) |
| Survives agent restart | ✗ (in-memory lost) | ✗ (in-memory lost) | ✗ (in-memory lost) | ✓ (Vector disk buffer) |
| Survives node restart | ✓ (Firehose is external) | ✓ (Pub/Sub is external) | ✓ (Event Hubs is external) | ✓ (if hostPath disk buffer) |
| DaemonSet eviction risk | Low (managed agent) | Low (managed agent) | Low (managed agent) | Medium (node pressure) |
Fluent Bit default behaviour (all providers) uses an in-memory ring buffer. Under sustained backpressure, older events are dropped silently. Switch to the filesystem storage backend (storage.type filesystem) to persist events across agent restarts at the cost of disk I/O.
Vector disk buffers persist events to a hostPath volume on the node. With 9 sinks at 1 GiB each, the buffer directory can grow up to 9 GiB — size your node disk accordingly. See Part 5 of the self-hosted series for the per-sink disk buffer configuration.
Under memory or disk pressure, the Kubernetes node eviction controller may kill DaemonSet pods before user workloads. An in-memory Fluent Bit buffer is lost on eviction — events buffered since the last flush are dropped permanently. Use disk-backed buffers and set priorityClassName: system-node-critical on the DaemonSet to reduce eviction risk.
FAQ🔗
Does GKE send logs to Cloud Logging automatically for all pod logs?🔗
Yes, if Cloud Logging is enabled on the node pool (default since GKE 1.18). The managed logging agent on each GKE node collects pod stdout/stderr from /var/log/pods/ and ships it to Cloud Logging. No custom DaemonSet deployment is needed. The destination is the configured log bucket, usually _Default unless you regionalized or rerouted logs. To redirect to a different project or region, create a Log Sink and adjust the default sink routing.
Can I use Kafka instead of Kinesis / Pub/Sub / Event Hubs?🔗
Yes, for all providers. Self-managed Kafka (or MSK on AWS, Confluent Cloud) can act as the ingest buffer, with a separate consumer writing to S3/GCS/Blob. This adds infrastructure complexity but provides provider-agnostic portability. Azure Event Hubs Standard/Premium tiers expose a native Kafka API — the simplest managed Kafka-compatible endpoint across the three major providers.
How do I handle multiline logs (Java stack traces) with managed agents?🔗
- CloudWatch Agent: use
multi_line_start_patternin the agent config to buffer lines until the next log start marker. - Fluent Bit (all providers): use the
multiline.parseroption with a custom regex for the stack trace start pattern (e.g.,^\d{4}-\d{2}-\d{2}). - Vector: use the
multilineoption in thekubernetes_logssource withcondition_patternandmode: halt_withfor Java/Python stack traces. - GKE managed logging agent: handles multiline automatically for well-known formats (Java, Python); custom parsers require a Fluent Bit DaemonSet configuration.
What happens when the destination is unavailable (ClickHouse restart, S3 outage)?🔗
- Kinesis Firehose: buffers in-flight (configurable buffer size 1–128 MB, 60–900s window), retries on failure, writes to S3 error prefix on permanent failure. Max guaranteed delivery window: 24 hours.
- Pub/Sub: retains unacked messages for up to 7 days. If the BigQuery subscription fails, messages accumulate until acknowledged or the retention period expires.
- Event Hubs: retains events for the configured retention period (1–7 days Standard, 90 days Premium). Consumers can replay from any offset during this window.
- Vector with disk buffers: see Part 5 of the self-hosted series for the 1 GiB per-sink disk buffer pattern.
Part 1: Overview & 7-year cost comparison
Part 2: Pre-Flight, Flexibility & Auditor Export
Part 4: Security & Compliance — IAM/RBAC, encryption, WORM, GDPR
Part 5: Query, Dashboards & Recommendations
Part 6: Production Checklist, Guardrails & Runbooks
Self-hosted alternative: Elasticsearch vs. OpenSearch vs. Loki vs. Quickwit vs. ClickHouse — Part 2 (Operations)