Log Archiving Query & Recommendations: AWS / GCP / Azure / OVHcloud
Table of contents
This post covers query interfaces, dashboard building, alerting, and cold-tier query behaviour for the managed log archiving comparison, and closes with concrete recommendations for each scenario.
- Part 1 — Overview & Cost: Services, storage model, 7-year cost comparison
- Part 2 — Pre-Flight, Flexibility & Auditor Export: Pre-flight checklist, retroactive flexibility, auditor export
- Part 3 — Operations: Kubernetes integration, ingest pipeline, backup & DR
- Part 4 — Security & Compliance: IAM/RBAC, encryption, WORM, GDPR, compliance certificates
- Part 5 — Query, Dashboards & Recommendations — this post
- Part 6 — Production Checklist, Guardrails & Runbooks: Loss detection, privacy, schema, cost guardrails, runbooks, fire drills
Self-hosted alternative: Elasticsearch vs. OpenSearch vs. Loki vs. Quickwit vs. ClickHouse — Part 4 (UX)
Query Interfaces🔗
| AWS | GCP | Azure | OVH | |
|---|---|---|---|---|
| Query language | CloudWatch Logs Insights / SQL (Athena) | SQL (BigQuery / Log Analytics) | KQL (Kusto) | ClickHouse SQL |
| Full-text search | ✓ (Log Insights, OpenSearch Service) | ✓ (Log Analytics search bar) | ✓ (KQL search, Log Analytics) | ✓ (ClickHouse full-text index) |
| SQL on archived logs | ✓ (Athena, $5/TB) | ✓ (BigQuery, $6.25/TiB) | ✓ (ADX KQL, Synapse $5/TB) | ✓ (ClickHouse SQL, free) |
| Query builder UI | CloudWatch Logs Insights, Athena console | Log Analytics UI, BigQuery console | Log Analytics workspace | Grafana (ClickHouse plugin) / ClickHouse Play |
| CLI / API | AWS CLI, Athena API | bq CLI, BigQuery API | az monitor, ADX API | clickhouse-client / ClickHouse HTTP API |
CloudWatch Logs Insights🔗
CloudWatch Logs Insights uses a purpose-built query language with a familiar pipe syntax:
fields @timestamp, @message, @logStream
| filter @message like /ERROR/
| sort @timestamp desc
| limit 50
Strengths: fast for operational queries on recent logs (< 30 days); built-in aggregations (stats, histograms). Weaknesses: not SQL; billing per GB scanned regardless of result size; no joins. For archived data in S3, use Athena with standard SQL.
Amazon Athena🔗
Athena runs standard SQL (Presto engine) over Parquet/ORC files in S3. Queries are billed at $5.00/TB scanned. Partitioning reduces scan volume significantly:
-- Efficient: date partition + service filter
SELECT timestamp, method, status, client_ip
FROM envoy_access_logs
WHERE year = '2025' AND month = '03'
  AND namespace = 'payments'
  AND status >= 500
ORDER BY timestamp DESC
LIMIT 1000;
With day-level partitioning and columnar Parquet, a query scanning 1 year of logs for a single service might scan only 10–50 GB instead of the full 36 TB — reducing cost from $180 to $0.25 per query. Poor partitioning is the fastest way to turn Athena into an unexpectedly expensive system.
Google BigQuery / Log Analytics🔗
BigQuery supports standard SQL with excellent columnar pruning. Log Analytics in Cloud Logging uses BigQuery as its backend and exposes a simplified search UI — queries via the Log Analytics UI are free (no BigQuery on-demand charge). Queries via the BigQuery API or Looker Studio are billed at $6.25/TiB scanned.
-- BigQuery: find errors in the last 7 days
SELECT
timestamp,
jsonPayload.message,
resource.labels.namespace_name,
jsonPayload.level
FROM `my-project.log_archive.container_logs`
WHERE DATE(timestamp) >= DATE_SUB(CURRENT_DATE, INTERVAL 7 DAY)
AND jsonPayload.level = 'ERROR'
ORDER BY timestamp DESC
LIMIT 1000;BigQuery columnar pruning + date partitioning is excellent for structured JSON logs. For free-text log search (needle-in-a-haystack over unstructured logs), BigQuery is slower than an inverted-index system like OpenSearch.
Azure KQL (Kusto Query Language)🔗
KQL is the query language for Log Analytics, Azure Data Explorer, and Sentinel. It is powerful and expressive but non-standard — a meaningful operational cost for teams rotating engineers.
ContainerLog
| where TimeGenerated > ago(7d)
| where LogEntry has "ERROR"
| summarize count() by bin(TimeGenerated, 1h), ContainerName
| order by TimeGenerated desc
KQL supports cross-table joins, regex, machine learning anomaly detection (series_decompose_anomalies), and time-series functions — capabilities that go well beyond standard SQL. However, archive-tier data is not always-interactive: use search jobs for targeted retrieval, or restore jobs when you need full KQL over a historical time range. Restore jobs are billed by restored volume and active restore duration.
OVH / Self-Hosted ClickHouse🔗
Standard SQL via clickhouse-client, HTTP API, or Grafana datasource plugin. ClickHouse SQL supports window functions, JOINs, JSON extraction, and very fast columnar queries — see Part 4 of the self-hosted series for cold-tier query behaviour.
Dashboards🔗
| AWS | GCP | Azure | OVH | |
|---|---|---|---|---|
| Built-in dashboard | CloudWatch Dashboards | Cloud Monitoring Dashboards | Azure Workbooks / Dashboards | — (no built-in; use Grafana) |
| External BI/Grafana support | ✓ (Grafana CloudWatch, Athena datasource) | ✓ (Grafana BigQuery datasource, Looker Studio) | ✓ (Grafana Azure Monitor datasource) | ✓ (Grafana for ClickHouse) |
| SQL → chart (ad-hoc) | Athena console | BigQuery console | ADX / Synapse | ClickHouse Play / Grafana |
| Public (unauthenticated) dashboards | ✓ (CloudWatch Dashboard: public link) | ✗ (native) / ✓ (Looker Studio public) | ✓ (Azure Dashboard public URL) | ✓ (Grafana Public Dashboards) |
| Dashboard-as-Code | CloudFormation / Terraform | Terraform (google_monitoring_dashboard) | Terraform / ARM / Bicep | Grafana provisioning |
CloudWatch Dashboards support CloudWatch metrics and Log Insights queries in the same view. Dashboards can be shared via a public URL (read-only, no auth). Limited to CloudWatch datasources — no mixing with S3/Athena data in the same widget.
Google Cloud Monitoring Dashboards visualise Cloud Logging metrics, Pub/Sub throughput, and custom metrics. Looker Studio (formerly Data Studio) provides a free, shareable BI layer over BigQuery — useful for operational log analytics dashboards shared with non-technical stakeholders.
Azure Workbooks are the native analytics dashboard for Log Analytics and ADX — they support KQL queries, markdown, parameters, and conditional formatting. Azure Managed Grafana is a fully managed Grafana instance that pre-wires Azure Monitor, Log Analytics, and ADX as datasources.
Grafana works well across all providers via datasource plugins (CloudWatch, BigQuery, Azure Monitor, ClickHouse). If you are already running Grafana, using provider-specific plugins rather than native dashboards is often the most operationally consistent choice.
Alerting🔗
| AWS | GCP | Azure | OVH | |
|---|---|---|---|---|
| Metric-based alerts | CloudWatch Alarms | Cloud Monitoring Alerting | Azure Monitor Alerts | Grafana Alerting (self-hosted) |
| Log-based alerts | CloudWatch Log Alarms | Log-based Alerting Policies | Log Alert Rules (KQL) | Grafana Alerting (ClickHouse) |
| PagerDuty / Opsgenie integration | ✓ (via SNS) | ✓ (via PagerDuty channel) | ✓ (action group) | ✓ (Grafana contact points) |
| Alertmanager-compatible | ✗ | ✗ | ✗ | ✓ (Grafana Alerting) |
| Alert on archived log queries | ✗ (archive is not live-queried) | ✗ | ✗ | ✗ |
Note: none of the providers support alerting on archived log data directly — archival tiers are not designed for live query patterns. Alerts must run against the hot tier (CloudWatch Logs, Cloud Logging, Log Analytics) within the standard retention period.
CloudWatch Alarms trigger on metric data, including custom metrics published from Log Insights query results. The ALARM → SNS → Lambda → PagerDuty chain is the standard AWS alerting path. CloudWatch Contributor Insights can surface anomalies in log patterns without writing explicit queries.
GCP Log-based Alerting Policies allow a filter expression (Cloud Logging syntax) to trigger an alert when the log volume exceeds a threshold. More advanced anomaly detection uses Cloud Logging + Vertex AI pipelines.
Azure Monitor Alerts support both metric alerts and log alerts. Log alert rules run a KQL query on a schedule (minimum 1-minute interval) and trigger an action group (email, webhook, ITSM, PagerDuty, Slack) when the query result crosses a threshold.
Cold-Tier Query Behaviour🔗
Querying logs from 4 years ago is the realistic use case for a 7-year archive. The query experience varies significantly.
| AWS (Athena + S3) | GCP (BigQuery) | Azure (Monitor Archive) | OVH (self-hosted ClickHouse) | |
|---|---|---|---|---|
| Async query (server-side) | ✓ (Athena is always async) | ✓ (BQ slots, runs server-side) | ✓ (search jobs; restore jobs for full analytics) | ✗ (synchronous) |
| Query without rehydration | ✓ (direct S3 query) | ✓ (direct BQ query) | Partial (search jobs scan archive; restore for interactive KQL) | ✓ (direct S3/IA query) |
| Default timeout | None (Athena: 30 min max execution, configurable) | None (BQ: depends on slot availability) | Search / restore job duration | ClickHouse: unlimited (max_execution_time=0) |
| Progress indicator | Athena console: scan progress | BQ console: progress bar | Search / restore job status | ✗ (Grafana: wait for response) |
| Cache after first query | ✓ (Athena query result cache: 24h, same query) | ✓ (BQ cached results: 24h, same query) | N/A | ✓ (ClickHouse shard cache) |
| Typical latency (1 month of data) | 10–60 seconds (Parquet, partitioned) | 5–30 seconds (BQ columnar) | Minutes to hours (search/restore) + seconds (KQL) | 5–30 seconds (ClickHouse columnar) |
AWS Athena is entirely asynchronous: you submit a query, it runs server-side, and you poll for results. The console shows scan progress; the API returns an executionId that you poll with GetQueryExecution. No timeout on the query itself; the maximum execution time is configurable (default 30 minutes). For 4-year data queries with good partitioning and Parquet format, typical latency is 10–60 seconds.
GCP BigQuery runs queries server-side with automatic slot scheduling. Very wide time range queries (4 years) are handled via slot concurrency — BigQuery splits the work across multiple compute slots automatically. The console shows a progress bar; queries never time out on the server side (though network connections to the API may). First execution on cold data is slower; the same query re-run within 24 hours returns cached results at no cost.
Azure Monitor Archive has two long-term access modes. Search jobs scan data in long-term retention and write matching results into a new Analytics table, which is the right fit for targeted investigations. Restore jobs copy a time range back to the interactive tier for full KQL analysis; this can take hours and is billed by restored volume and active restore time. For occasional investigative queries on 4-year-old data, plan operational lead time and decide whether a search job is enough or whether the incident requires a restore. This is the most significant operational difference between Azure Monitor and the other providers: Azure Archive behaves more like compliance storage with retrieval workflows than an always-interactive log archive.
Self-hosted ClickHouse on OVH (from the companion series) queries S3/IA data synchronously. The Grafana datasource timeout must be configured high enough (10–30 minutes for wide time ranges). ClickHouse’s columnar pruning and skip indices make even 4-year queries fast when WHERE clauses on indexed columns are tight. See Part 4 of the self-hosted series for detailed cold-tier query guidance.
Recommendations🔗
Choose AWS when🔗
- You are already deeply invested in the AWS ecosystem (EKS, EC2, IAM) — operational consistency outweighs cost for small teams
- You need managed OpenSearch Service for full-text log search with Kibana dashboards and are willing to pay $60,000–$100,000+ over 7 years for the convenience
- You want the richest set of object storage options (Standard-IA, Glacier IR, Glacier Flexible) for tiered cost optimization
- Your compliance requirements mandate BSI C5 attestation and you want a proven enterprise-scale provider
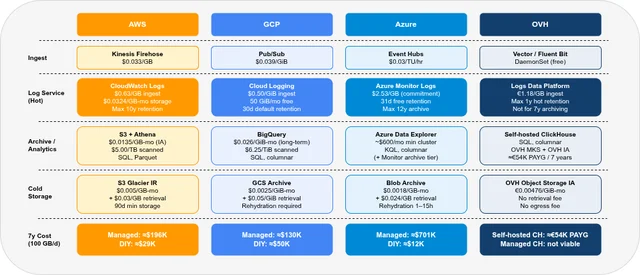
Best cost path on AWS: Kinesis Firehose → S3 Standard-IA (Parquet) + Athena. ≈$29,000 over 7 years at 100 GB/day.
Choose GCP when🔗
- You are running on GKE — Cloud Logging automatic collection and Log Analytics SQL queries with zero setup is a genuine productivity advantage
- You want a modern columnar analytics layer (BigQuery) that is also your data warehouse — log data and business data in the same SQL engine simplifies cross-correlation queries
- The Pub/Sub → BigQuery bypass path at ≈$50,000 / 7 years is acceptable, and you want to avoid per-query Athena costs in favour of BigQuery’s on-demand pricing
Best cost path on GCP: Pub/Sub → BigQuery (bypass Cloud Logging for high-volume ingest). ≈$50,000 over 7 years at 100 GB/day.
Choose Azure when🔗
- Your organization is Azure-first (Active Directory / Entra ID, AKS, Azure DevOps) and operational consistency with existing Azure RBAC and monitoring is the priority
- You need KQL-based alerting and workbooks that integrate with Azure Sentinel (SIEM) for security log correlation
- Compliance requirements mandate Azure-specific certifications (e.g., Azure for German public sector: BSI C5 + German Data Localization)
Avoid Azure Monitor Logs for pure log archiving at 100 GB/day over 7 years — the $2.53/GB ingest cost makes it prohibitively expensive (≈$701,000 total). Best cost path on Azure: Event Hubs → Blob Cold LRS + Synapse Analytics. ≈$12,000 over 7 years. Add Azure Data Explorer (≈$600+/month cluster) only if continuous analytics queries justify the cost.
Choose OVH (self-hosted ClickHouse) when🔗
- Cost is the primary constraint — self-hosted ClickHouse on OVH MKS + OVH IA is 2–12× cheaper than the managed cloud paths (AWS ≈3×, GCP ≈2×, Azure ≈12×)
- You have Kubernetes operational expertise (the setup is non-trivial — see Part 3 of this series for the OVH MKS setup)
- EU/France-only data residency is required without SCCs or Schrems II complexity
- You need maximum query flexibility — ClickHouse SQL supports any aggregation, time-series functions, and JOIN-based cross-correlation at near-interactive latency even on cold S3/IA data
Digital sovereignty note: OVH is the only provider in this comparison not subject to US jurisdiction (Cloud Act, FISA Section 702). For organisations where EU-sovereign infrastructure is a hard requirement — public sector, healthcare, defence-adjacent industries — OVH removes the legal uncertainty that Standard Contractual Clauses leave open for AWS, GCP, and Azure. This significantly reduces the legal exposure associated with US extraterritorial access regimes such as the Cloud Act and FISA Section 702.
OVH managed offerings (LDP, Managed ClickHouse) are not recommended for 7-year archiving at 100 GB/day. Use OVH’s Object Storage IA tier as the backend for self-hosted ClickHouse — it is the cheapest cold storage tier in this comparison.
FAQ🔗
Can I query CloudWatch Logs data that is older than 30 days?🔗
Yes, if you have not set a retention period shorter than 30 days. CloudWatch Logs retains data until the configured retention period expires (default: never expire). Log Insights queries work on all retained data regardless of age — you are billed per GB scanned. For data older than 30 days that has been exported to S3, use Athena.
Is Google BigQuery suitable for free-text log search (not just structured queries)?🔗
BigQuery is optimised for structured, columnar queries. Free-text search using WHERE message LIKE '%error text%' triggers a full scan of the message column — expensive and slow for large datasets. BigQuery search indexes exist, but add storage cost and operational complexity; for production log search at scale, the trade-off rarely justifies the overhead. For faster full-text search, use the Cloud Logging Log Analytics search bar (powered by BigQuery but with additional indexing for the hot tier), or store logs in both BigQuery (for structured SQL analytics) and Cloud Logging (for full-text search within the 30-day hot window).
How long does Azure Monitor archive restore take, and can it be accelerated?🔗
For targeted retrieval, use an Azure Monitor search job: it scans long-term retention and writes matching records into a new Analytics table. For broad interactive analysis, use a restore job; restore time depends on data volume and Azure’s internal queuing and can take hours. High Priority restore can reduce wait time for smaller datasets but is not always available. For compliance investigations where time-to-access matters, use Log Analytics long-term retention rather than Azure Blob Archive — the data stays inside the KQL ecosystem, even though access still runs through search or restore workflows.
Can I mix log data from multiple providers in a single Grafana dashboard?🔗
Yes. Grafana supports datasource mixing within a single dashboard. A combined operational view could show CloudWatch metrics (Grafana CloudWatch datasource), BigQuery log error counts (Grafana BigQuery datasource), and Azure Monitor alerts (Grafana Azure Monitor datasource) in adjacent panels. This is the primary advantage of using Grafana as the universal observability layer rather than each provider’s native dashboard — especially relevant for multi-cloud architectures.
Part 1: Overview & 7-year cost comparison
Part 2: Pre-Flight, Flexibility & Auditor Export
Part 3: Operations — Kubernetes integration, ingest pipeline, backup & DR
Part 4: Security & Compliance — IAM/RBAC, encryption, WORM, GDPR
Part 6: Production Checklist, Guardrails & Runbooks
Self-hosted alternative: Elasticsearch vs. OpenSearch vs. Loki vs. Quickwit vs. ClickHouse — Part 4 (UX)