Elasticsearch vs. OpenSearch vs. Loki vs. Quickwit vs. ClickHouse: Kubernetes Operations, Backup & DR
Table of contents
Cluster setup, ingest pipelines, and backup & disaster recovery differ significantly across Elasticsearch, OpenSearch, Grafana Loki, Quickwit, and ClickHouse — and these differences often matter more than raw performance when a log archive must run reliably for 7+ years.
This is Part 2 of a five-part series.
- Part 1 — Comparison: Storage tiering, compression, resource consumption, query languages, SaaS options
- Part 2 — Operations — this post: Setup, ingest pipeline, ECS vs. OTel, backup & DR, observability, alerting
- Part 3 — Security & Compliance: Encryption, RBAC, WORM / S3 Object Lock
- Part 4 — UX, Dashboards & Alerts: UI layers, log search UX, cold-tier query behaviour, dashboard building, sharing, alerting
- Part 5 — Use Case: Vector, Istio/Envoy, nginx, Java on OVH MKS — complete ClickHouse ingestion setup and monthly awffull report
Setup Requirements🔗
Running a log archive in production means maintaining the system for years. The setup complexity and HA requirements vary significantly across the five candidates.
| Elasticsearch | OpenSearch | Loki | Quickwit | ClickHouse | |
|---|---|---|---|---|---|
| Min. nodes for HA | 3 master-eligible + 2 data (5+ total) | same as ES | 3+ (write / read / backend roles) | 2+ indexers/searchers + HA PostgreSQL | 3 nodes (ClickHouse server + Keeper co-located) |
| External coordination | none (built-in Raft since 7.x) | none (built-in Raft) | none | PostgreSQL (for HA metastore) | ClickHouse Keeper (built-in, 3-node quorum) |
| Object storage dependency | optional (required for Frozen Tier) | optional (required for Frozen Tier) | required (primary store) | required (primary store) | optional (required for cold tier) |
| Kubernetes operator | ECK (official, very mature) | OpenSearch Operator (less mature) | Helm chart (grafana/loki, well-maintained) | Helm chart (community) | clickhouse-operator (Altinity, mature) |
| Setup complexity | High (many node roles at scale) | High | Medium | Medium | Medium |
Elasticsearch / OpenSearch🔗
Minimum HA requires 3 master-eligible nodes for quorum to prevent split-brain. At scale, dedicated master, data, coordinating, and ingest node roles are common, growing the cluster to 7+ nodes. No external coordination service is needed — both dropped ZooKeeper in favour of a built-in Raft implementation in version 7.x.
ECK (Elastic Cloud on Kubernetes) is the de-facto Kubernetes operator for Elasticsearch: official, very mature, handles rolling upgrades and keystore management. The OpenSearch Operator is functional but less battle-tested.
Loki🔗
Loki runs in three modes: monolithic (development only), Simple Scalable (3 roles: write / read / backend), and full microservices. Simple Scalable with 2+ replicas per role is the recommended production configuration. Object storage is required from day one — there is no local-only production mode. The Compactor must run as a singleton; leader-election HA is possible but adds operational complexity. No external coordination service is needed.
Quickwit🔗
Stateless Indexers and Searchers make horizontal scaling straightforward. The operational complexity concentrates in the Metastore: in development mode a file on S3 is sufficient, but for production HA it requires PostgreSQL (e.g. RDS, CloudSQL, or self-hosted Patroni). Note that ClickHouse itself is a database and brings its own cluster requirements (Keeper + ReplicatedMergeTree); Quickwit adds PostgreSQL on top of that — a second separate database to deploy and maintain alongside the log store itself.
ClickHouse🔗
HA in ClickHouse requires two mechanisms working together:
- ReplicatedMergeTree table engine: data is replicated between ClickHouse server nodes.
- ClickHouse Keeper (built-in ZooKeeper replacement, stable since 22.x): coordinates replicated table state and requires a 3-node quorum.
The minimum production HA setup is 3 nodes, each running ClickHouse server and ClickHouse Keeper co-located. For larger clusters Keeper is moved to 3 dedicated nodes. The clickhouse-operator (Altinity) handles this topology well on Kubernetes. ZooKeeper is no longer required — Keeper is fully self-contained in the ClickHouse binary.
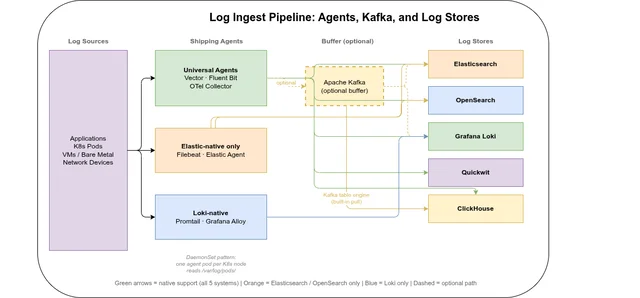
Ingest: Getting Data In🔗
Choosing a log store also means choosing how data arrives there. The two variables are the shipping agent (runs on the source node or as a Kubernetes DaemonSet) and whether an intermediate buffer like Kafka is used.
Agent support matrix🔗
| Agent | Elasticsearch / OpenSearch | Loki | Quickwit | ClickHouse |
|---|---|---|---|---|
| Vector | ✓ native sink | ✓ native sink | ✓ HTTP sink | ✓ native sink |
| Fluent Bit | ✓ native | ✓ native | ✓ HTTP output | ✓ HTTP output |
| Fluentd | ✓ native | ✓ plugin | ✓ HTTP plugin | ✓ plugin |
| Filebeat / Elastic Agent | ✓ native | ✗ | ✗ | ✗ |
| Promtail | ✗ | ✓ native | ✗ | ✗ |
| Grafana Alloy | ✓ | ✓ native | ✓ OTLP | ✓ OTLP |
| OpenTelemetry Collector | ✓ exporter | ✓ exporter | ✓ OTLP native | ✓ community exporter |
| Kafka (as source) | ✓ Kafka Connector | ✓ consumer | ✓ native Kafka source | ✓ Kafka table engine |
Key agents🔗
Vector is the most versatile choice — it supports all five systems, is written in Rust (low CPU and memory overhead), and transforms events in-flight via VRL (Vector Remap Language). For a new product without legacy constraints, Vector as a Kubernetes DaemonSet is the most straightforward path.
Fluent Bit is lighter still (C binary, ~1 MB), and the default DaemonSet agent in many Kubernetes distributions. It covers ES/OpenSearch, Loki, and ClickHouse well; its transformation capabilities are less expressive than VRL.
Filebeat and Elastic Agent are tightly coupled to the Elastic ecosystem. They are not usable with Loki, Quickwit, or ClickHouse. If you are already committed to Elasticsearch or OpenSearch they are a natural fit; otherwise, they constrain future optionality.
OpenTelemetry Collector is increasingly the standard for unified observability pipelines — logs, traces, and metrics through a single agent. Quickwit has native OTLP support (gRPC and HTTP). ClickHouse has a community OTLP exporter. For greenfield deployments where structured logs, traces, and metrics all need to land in the same store, OTel Collector is worth evaluating seriously.
Kafka as a decoupling buffer🔗
For high ingest rates or when multiple consumers need the same log stream (archiving to ClickHouse and real-time alerting via another system), Kafka as an intermediate buffer is a common pattern:
Agent → Kafka ──→ ClickHouse  (Kafka table engine, no separate consumer needed)
              ├──→ Loki        (Kafka consumer)
              └──→ ES/OS       (Kafka Connect)
ClickHouse has an advantage here: the Kafka table engine is built into the binary — ClickHouse pulls directly from Kafka topics via a Materialized View, without a separate consumer service.
Kubernetes deployment pattern🔗
The standard approach on Kubernetes is a DaemonSet (one agent pod per node) reading container logs from /var/log/pods/ as written by containerd. This requires no changes to application pods. A sidecar agent (one per application pod) is only warranted when pods need independent pipelines or different credentials.
Suggestion for a new product: Vector as DaemonSet → ClickHouse. Vector’s clickhouse sink writes directly via the HTTP interface, supports schema mapping in VRL, and requires no Kafka layer for moderate ingest rates.
Log Format Standards: ECS vs. OpenTelemetry🔗
Two field naming conventions dominate the log ecosystem. Committing to one at deployment time avoids silent query failures and broken dashboards years later when teams rotate and nobody remembers why log.level and severity_text coexist in the same pipeline.
Elastic Common Schema (ECS)🔗
- Key fields:
@timestamp,message,log.level,host.name,service.name,trace.id,span.id - Native output of: Elastic Agent, Filebeat, Metricbeat, Auditbeat
- Kibana and OpenSearch Dashboards built-in visualizations assume ECS field names
OpenTelemetry Semantic Conventions🔗
- Key fields:
timestamp(not@timestamp),body(notmessage),severity_text(notlog.level),resource.attributes.service.name(nested),trace_id,span_id(underscored, not dotted) - Native output of: OpenTelemetry Collector, Grafana Alloy
- Quickwit OTLP ingestion and the official ClickHouse OTel table schema use OTel column names
The practical problem🔗
Mixing conventions in the same pipeline causes invisible query failures: a dashboard filtered on log.level = "error" returns no results when data was shipped with severity_text. Vector VRL can rename fields in-flight, but someone must set this up and maintain it as agents and pipelines evolve over 7+ years.
| ES / OpenSearch | Loki | Quickwit | ClickHouse | |
|---|---|---|---|---|
| Native convention | ECS | Label-based (no fixed schema) | OTel Semantic Conventions | Flexible; official OTel schema uses OTel conventions |
For new deployments: choose one convention before ingesting the first log line.
- Existing Elastic/OpenSearch stack → ECS: changing convention later requires reprocessing existing data or maintaining dual-path queries.
- Greenfield OTel-first → OpenTelemetry Semantic Conventions: forward-compatible with the CNCF ecosystem, natively supported by Quickwit and ClickHouse’s OTel schema.
- Migrating from ES to ClickHouse: transform fields at ingest time via Vector VRL or OTel Collector transform processor. Define the target convention before migration — do not carry ECS field names into a new ClickHouse schema without an explicit mapping.
Operational Effort🔗
Initial setup is a one-time cost. Day-2 operations — upgrades, scaling, backup, failure recovery — recur across a 7+ year lifetime. The table below compares the key dimensions for both Kubernetes and bare-metal deployments.
| Elasticsearch | OpenSearch | Loki | Quickwit | ClickHouse | |
|---|---|---|---|---|---|
| K8s operator | ECK (official, very mature) | OpenSearch Operator (community) | Helm chart (no CRDs needed) | Community Helm chart | Altinity clickhouse-operator (mature) |
| Rolling upgrades | ✓ ECK-managed | ✓ operator-managed | ✓ stateless roles | ✓ stateless (trivial) | ✓ operator-managed |
| Upgrade path constraint | One major at a time | One major at a time | Minor-safe; re-index on major | No migration on binary upgrade | One major at a time |
| Backup strategy | Snapshot API → S3 | Snapshot API → S3 | S3 is primary (bucket-level) | S3 is primary (bucket-level) | clickhouse-backup + S3 |
| Horizontal scale | Medium (shard rebalancing) | Medium (shard rebalancing) | Easy (stateless) | Easy (stateless) | Medium (topology change) |
| Bare-metal packaging | deb/rpm + systemd | deb/rpm + systemd | Single binary + systemd | Single binary + systemd | deb/rpm + systemd |
| Main Day-2 pain point | ILM policy tuning, shard sizing | Same as ES, less mature tooling | Compactor singleton, caching | PostgreSQL HA maintenance | Merge queue, mutation ops |
Elasticsearch🔗
Kubernetes: ECK automates rolling upgrades, TLS certificate rotation, keystore secret injection, and node lifecycle management. Adding data nodes triggers automatic shard rebalancing — on multi-TB indices this can take hours and should be scheduled as a maintenance window. ECK is widely regarded as the most mature Kubernetes operator of the five systems compared here.
Bare metal: Official deb/rpm packages with a systemd unit. Upgrades follow a strict major-version ladder (7 → 8 → 9; no skipping). ILM policy tuning is an ongoing task: shard count mismatches between hot and cold tiers are the most common source of long-term over-allocation. Snapshots to S3/GCS/Azure Blob are the backup mechanism — mature and reliable, though full-cluster restores from snapshots are slow on large data sets.
OpenSearch🔗
Kubernetes: Operationally nearly identical to Elasticsearch. The OpenSearch Operator is community-maintained and covers the standard lifecycle, but has fewer automated recovery paths than ECK. Helm-chart deployments without an operator are common in smaller setups.
Bare metal: Package management and upgrade procedures mirror Elasticsearch. Index State Management (ISM) is the OpenSearch equivalent of ILM and is entirely free — no subscription required for any ILM-equivalent feature.
Loki🔗
Kubernetes: Stateless write / read / backend roles make operations straightforward — kubectl rollout restart on any role is safe without data loss. No PVCs are needed for indexers; chunk data lives in object storage. Two recurring operational constraints:
- Compactor singleton: must run as exactly one instance at a time. Simultaneous Compactor replicas corrupt the index. The Helm chart enforces this with
replicas: 1; leader-election HA is available but adds complexity. - Caching: Memcached or Redis for chunk and query-result caches are optional but strongly recommended for production query performance — adding another stateful component to maintain.
Bare metal: Single binary with a YAML config file, easy to run via systemd. The configuration surface is large, but the simple-scalable mode covers most production cases without deep parameter tuning.
Quickwit🔗
Kubernetes: The stateless architecture makes this the operationally lightest of the five: Indexers and Searchers carry no local state, so scaling up or down requires no rebalancing. Node replacement is transparent.
The critical stateful dependency is PostgreSQL (metastore). It requires its own HA story (Patroni, RDS Multi-AZ, CloudSQL HA, etc.) and must be backed up and upgraded independently of Quickwit. On Kubernetes this means running and maintaining a second stateful workload alongside Quickwit itself.
Bare metal: Two services to manage: the Quickwit binary and PostgreSQL. The Quickwit binary itself is stateless and trivial to update; PostgreSQL major-version upgrades are the main planned-maintenance item.
ClickHouse🔗
Kubernetes: The Altinity clickhouse-operator manages the full lifecycle: shard/replica topology, rolling upgrades, and Keeper configuration. For rolling upgrades, the Keeper quorum must remain stable — Keeper nodes are upgraded first, ClickHouse server nodes follow.
Ongoing operational concerns:
- Merge queue: MergeTree merges parts in the background. If ingest rate exceeds merge throughput, the part count per partition grows, slowing queries and eventually throttling inserts. Monitor
system.mergesandsystem.part_logfor backlog. - Data deletion: prefer
ALTER TABLE DROP PARTITIONor TTL rules overALTER TABLE DELETE. Mutations are asynchronous, rewrite data, and are resource-intensive — they should be avoided on high-volume log tables. - Backup:
clickhouse-backupis the standard open-source tool for snapshot + S3 upload. Unlike Elasticsearch, ClickHouse has no built-in snapshot API; backup scheduling and restore testing must be set up explicitly.
Bare metal: Official deb/rpm packages with a systemd unit. ClickHouse upgrades are generally safe one major at a time; Keeper state does not require migration between versions.
Backup and Disaster Recovery🔗
For a 7+ year archive, backup is a first-class operational requirement. The five systems take fundamentally different approaches depending on whether their primary store is local disk or object storage.
| Elasticsearch | OpenSearch | Loki | Quickwit | ClickHouse | |
|---|---|---|---|---|---|
| Backup mechanism | Snapshot API → S3 (SLM, free) | Snapshot API → S3 (SM, free) | S3 bucket replication / versioning | S3 replication + PostgreSQL WAL archiving | clickhouse-backup → S3 |
| Automation | SLM policies (Kibana) | SM policies (OpenSearch) | S3 lifecycle / cross-region replication | pgBackRest / pg_basebackup + S3 policies | CronJob / operator CRD |
| RPO | Snapshot interval (typically hourly) | Same as ES | Near-zero (S3 durability) | Near-zero for data; PostgreSQL RPO for metadata | Backup interval (hourly incremental) |
| RTO | Hours (large index restore) | Hours | Seconds (redeploy, repoint to same bucket) | Seconds for data + PostgreSQL restore time | Hours (hot-tier re-download); fast for cold |
| Frozen / cold tier | Already in S3 (no separate backup needed) | Already in S3 | All data in S3 | All data in S3 | Cold parts already in S3 |
| Tooling maturity | Very high (Snapshot API stable 10+ years) | High | N/A (S3 native) | Medium | Medium (clickhouse-backup is 3rd party) |
Elasticsearch and OpenSearch🔗
The Snapshot API is the standard backup mechanism for both. Snapshots are incremental — only new or changed Lucene segments are uploaded per run. Restore from a named snapshot re-opens the index without a data rebuild.
- SLM (Snapshot Lifecycle Management) in ES and SM (Snapshot Management) in OpenSearch automate scheduled snapshots with configurable retention — both free.
- Frozen tier indices are stored in S3 (Searchable Snapshots) and are their own backup. Only hot and warm tier indices require explicit snapshot policies.
- RTO caveat: restoring a large hot-tier index can take hours on multi-TB data. Restoration speed scales with the number of data nodes downloading in parallel.
- ECK / OpenSearch Operator: configure snapshot repositories via CRD; pair with SLM/SM policies in Kibana/OpenSearch Dashboards for automated scheduling.
Loki🔗
Loki’s architecture makes backup near-trivial: all data lives in object storage from the moment chunks are flushed (typically within minutes of ingestion). There is no local data to back up — the S3 bucket is the primary store and the archive simultaneously.
Recommended protections:
- S3 versioning on the Loki bucket: recovers from accidental deletion or compaction bugs
- Async Replication to a second bucket (ideally in a different region) for disaster recovery — the only copy of the data is in object storage, so region-level failure without replication means data loss
- Compactor persistent volume: holds small state files (marker files for compaction progress, a few MB). Back up with Velero on Kubernetes or a cron rsync on bare metal.
On OVH: Async Replication is available for cross-region DR. Key requirements and caveats:
- Versioning must be enabled on both source and destination buckets
- Source and destination must be in the same OVH Public Cloud project (cross-project replication is not supported)
- Objects existing before the replication rule was configured require a separate Batch Replication job — replication only covers new objects by default
- Delete markers are not replicated by default (prevents accidental deletion propagating to the replica); enable
DeleteMarkerReplication: Enabledonly if you want deletes to propagate - No latency SLA — replication is asynchronous with no guaranteed RPO
RTO is near-zero: deploy new Loki pods pointed at the same (or replica) S3 bucket and the cluster is immediately operational. No index rebuild, no data restore required.
Quickwit🔗
Like Loki, Quickwit stores all split data in object storage — S3 replication covers the data. The same OVH Async Replication caveats apply (versioning required, same project, Batch Replication job for existing objects). The additional dependency is the PostgreSQL metastore, which requires its own backup strategy:
- pg_dump for simple setups (RPO = dump interval)
- WAL archiving (pgBackRest, pg_basebackup) for near-zero RPO in production
- Metastore and S3 data must be backed up in a consistent state — a metastore snapshot that references splits not yet in S3 (or vice versa) causes index inconsistencies on restore. Test restore procedures end-to-end, not just individual component backups.
ClickHouse🔗
ClickHouse has no built-in snapshot API — backup requires an external tool.
clickhouse-backup (open-source, maintained by Altinity) is the de-facto standard:
clickhouse-backup create my-backup-$(date +%Y%m%d)
clickhouse-backup upload my-backup-$(date +%Y%m%d)- Incremental mode: only uploads parts absent from the previous backup
- Targets: S3, GCS, Azure Blob, local filesystem
- Kubernetes: run as a CronJob or via the
ClickHouseBackupCRD (Altinity operator) - Restore:
clickhouse-backup download+restorere-attaches frozen parts to the table without rewriting data
S3 cold-tier parts (already moved by TTL) are inherently protected if the S3 bucket has versioning or cross-region replication — clickhouse-backup does not re-upload them.
Avoid filesystem snapshots for ClickHouse: parts in mid-merge at snapshot time produce an inconsistent state on restore.
ClickHouse restore tooling is less battle-tested than the Elasticsearch Snapshot API. Run restore drills on a separate cluster before you need to recover from an actual incident. A backup that has never been tested is not a backup.
Hidden Cost: S3 API Request Fees🔗
Object storage is priced on two axes: storage per GB/month and API requests per thousand operations. Storage costs are predictable and grow linearly. Request fees are invisible until a query pattern or a misconfigured cache triggers thousands of GET requests against cold data.
This is primarily relevant for AWS S3 ($0.0004 per 1,000 GET requests) and GCP Cloud Storage ($0.004 per 10,000 operations). OVH Object Storage has no per-request fees — storage cost only, which eliminates this concern entirely for OVH deployments.
| Cold data scan — GET requests generated | Mitigation | |
|---|---|---|
| Elasticsearch Frozen Tier | Many GETs per query (one per Lucene segment file) | Shard request cache; limit unscoped frozen queries |
| OpenSearch Frozen Tier | Same as ES | Same |
| Loki | One GET per chunk read | Chunk cache (Memcached / Redis) |
| Quickwit | Multiple GETs per split accessed | Split cache; tag_fields pruning skips splits entirely |
| ClickHouse cold tier | One GET per part file accessed | Mark cache + skip indexes prune parts before read |
At AWS S3 pricing, a query scanning 10,000 cold objects costs ~$0.004. At 1,000 such queries per day over a year that is ~$1,500 in request fees — not dominant, but not zero.
Mitigations common to all systems:
- Enable local read caches (ES shard cache, Quickwit split cache, ClickHouse mark cache) to avoid re-fetching unchanged cold objects
- Always scope queries with a time range to prevent unbounded scans across the full 7-year archive
- Batch investigative queries: run a handful of broad queries sequentially rather than many interactive point queries against the same cold time window
Observability🔗
A system retained for 7+ years must be monitorable across software versions, operator rotations, and tooling changes. The five systems differ substantially here.
| Elasticsearch | OpenSearch | Loki | Quickwit | ClickHouse | |
|---|---|---|---|---|---|
| Metrics format | Prometheus (via exporter) or Metricbeat | Prometheus (official plugin) or Performance Analyzer | Prometheus (native /metrics) | Prometheus (native /metrics) | Prometheus (native /metrics since 20.1) |
| Built-in dashboards | Kibana Stack Monitoring | OpenSearch Dashboards monitoring | Grafana Loki Mixin (ships with kube-prometheus-stack) | Grafana dashboards (community) | Official Grafana plugin + community dashboards |
| Self-introspection | /_cluster/health, /_nodes/stats REST API | same as ES + Performance Analyzer REST | per-component HTTP endpoints | /api/v1/cluster REST, per-component /metrics | system.* tables (SQL-queryable) |
| Tracing support | APM integration | — | Jaeger / Tempo (components emit traces) | OTel-native (ingests and emits) | — |
| Maturity | Very high | High | High (within Grafana stack) | Medium (younger ecosystem) | Very high (database self-monitoring) |
Elasticsearch🔗
Exposes a rich REST monitoring API (/_cluster/health, /_nodes/stats, /_cat/*). Kibana Stack Monitoring provides ready-made dashboards. Prometheus scraping requires the community prometheus-elasticsearch-exporter or Metricbeat. The key operational signals to track are JVM heap usage and GC pause times — heap pressure and GC storms are the most common root cause of ES degradation. Very mature; the Elastic stack has been operated in production for 15+ years.
OpenSearch🔗
Ships the Performance Analyzer plugin (enabled by default), which exposes per-node metrics via a dedicated REST port. An official Prometheus exporter plugin is available. The monitoring story is similar to Elasticsearch, though some community tooling (exporters, Grafana dashboards) is less comprehensive due to the younger ecosystem.
Loki🔗
All components natively expose Prometheus /metrics. The Grafana Loki Mixin — jsonnet-generated Grafana dashboards and Prometheus alerting rules — ships in the repository and is included in kube-prometheus-stack, giving pre-built production dashboards out of the box. Loki can be used to store its own component logs (dogfooding within the Grafana LGTM stack). All components have built-in tracing instrumentation for Jaeger or Grafana Tempo.
Quickwit🔗
Native Prometheus /metrics on all components. Grafana dashboards are available but less comprehensive than the Loki Mixin. The REST API at /api/v1/cluster and /api/v1/indexing/plan provides cluster state inspection. As an OpenTelemetry-native system, Quickwit can both ingest and emit OTel signals — a coherent observability story if you are already running an OTel collector pipeline.
ClickHouse🔗
The standout feature is system.* tables — ClickHouse records all operational data into persistent, SQL-queryable tables on the cluster itself:
system.query_log— every query: execution time, memory consumed, bytes read, query textsystem.part_log— every merge, insert, and split of MergeTree data partssystem.metric_log— CPU, memory, and disk I/O sampled over timesystem.asynchronous_metric_log,system.crash_log, and more
Questions like “which query consumed the most memory last week?” or “how many merges ran during yesterday’s S3 upload spike?” are answerable with a SQL query — no external dashboard required. Native Prometheus /metrics and the official Grafana ClickHouse datasource plugin provide standard dashboard integration on top of this.
Alerting Integration🔗
For a log archive, alerting on log content is often secondary to retention and search. But when it matters — detecting error patterns, rate anomalies, or security events — the five systems have very different built-in capabilities.
| Elasticsearch | OpenSearch | Loki | Quickwit | ClickHouse | |
|---|---|---|---|---|---|
| Native alerting | ✓ Watcher + Detection Rules (free) | ✓ Alerting plugin (free) | ✓ Ruler (Prometheus-compatible) | ✗ | ✗ |
| Prometheus Alertmanager | Via rules + ES Prometheus exporter | Via OpenSearch Prometheus plugin | ✓ native (LogQL → Alertmanager) | Via external Prometheus queries | Via Prometheus CH exporter |
| Grafana Alerting | ✓ | ✓ | ✓ native | ✓ community datasource | ✓ official plugin |
| Alert on log content | ✓ query-based rules | ✓ SQL / PPL monitor queries | ✓ LogQL count/rate expressions | External polling only | Grafana or scheduled SQL |
Elasticsearch Watcher supports query-based alert rules (e.g. “fire if error rate exceeds threshold in the last 5 minutes”) with HTTP, email, Slack, and PagerDuty actions. Kibana Detection Rules provide a higher-level UI. Both are free in the basic tier.
OpenSearch Alerting plugin (free) adds SQL and PPL (Piped Processing Language) monitor queries in addition to ES-style query monitors. Destinations include Slack, webhook, and SNS.
Loki Ruler converts LogQL expressions into Prometheus recording and alerting rules sent to Alertmanager — seamless if you already run kube-prometheus-stack.
ClickHouse and Quickwit have no native alerting engine. The standard pattern is Grafana Alerting: attach an alert rule to a Grafana panel backed by a ClickHouse SQL query. For custom logic, a Kubernetes CronJob running clickhouse-client -q "SELECT ..." is lightweight and maintainable without additional infrastructure.
FAQ🔗
How do I back up ClickHouse reliably in Kubernetes?🔗
The clickhouse-backup tool (open-source, maintained by Altinity) supports incremental backups to S3/GCS/Azure Blob. On Kubernetes it runs as a CronJob or via the ClickHouseBackup CRD when using the Altinity clickhouse-operator. Unlike Elasticsearch’s well-tested Snapshot API, ClickHouse backup tooling requires explicit setup — schedule regular backups and test restores proactively rather than discovering gaps during an incident.
Can I migrate existing log data from Elasticsearch to ClickHouse?🔗
There is no automated migration path — the data models are fundamentally different (document store with Lucene inverted index vs. columnar MergeTree). Migration requires: (1) defining a ClickHouse schema mapping ES fields to typed columns, (2) exporting data from Elasticsearch via the Scroll API or snapshot-to-Parquet tooling, (3) bulk-inserting into ClickHouse. For a 7+ year archive, a parallel-run approach — routing new data to ClickHouse while ES serves historical queries — is more practical than a full bulk migration.
Part 1: Comparison, storage model, compression, resource consumption, ingest, and SaaS options
Part 3: Security & Compliance — encryption, RBAC, and WORM compliance