ClickHouse Use Case: Vector, Istio, nginx, Java on OVH MKS
Table of contents
The first four parts of this series compared Elasticsearch, OpenSearch, Loki, Quickwit, and ClickHouse across storage models, operations, security, and UX. This part shows what a concrete production setup looks like when the decision has been made: ClickHouse as the log store, Vector as the ingestion agent, running on OVH Managed Kubernetes Service (MKS) with OVH Object Storage as the cold tier.
This is Part 5 of a five-part series:
- Part 1 — storage models, compression, resource consumption, and SaaS options
- Part 2 — cluster setup, Kubernetes operations, backup and disaster recovery
- Part 3 — encryption, RBAC, and WORM compliance
- Part 4 — UI layers, dashboards, alerting, and cold-tier query behaviour
- Part 5 — this post
TL;DR — Why this setup?🔗
ClickHouse with Grafana is excellent for live dashboards and drill-down investigation: a SQL query over the last hour returns in milliseconds, Grafana renders the panel, done. But even ClickHouse has a different cost profile for a monthly summary that aggregates millions of rows across dozens of dimensions (top URLs, referrers, user agents, countries, response codes) and renders 30+ graphs — the query runs, the browser waits, and the result disappears when you close the tab.
AWFFull takes the opposite approach: it reads raw access logs once, keeps all state in a compact binary history file, and writes static HTML + PNG that loads instantly — no query layer, no index, no running server. For the typical use case (a monthly overview of who accessed what, from where, with which agents) this is exactly the right trade-off.
| Grafana + ClickHouse | AWFFull (this setup) | |
|---|---|---|
| Live traffic, last 1h | ✓ best tool | ✗ not designed for this |
| Drill-down on a specific request | ✓ SQL, any filter | ✗ summary only |
| Monthly overview report | Possible, but query on demand | ✓ static HTML, instant, shareable |
| Historical trend across 7 years | Cold S3 query, seconds to minutes | ✓ incremental .hist, seconds to generate |
| No third-party JS / tracking | depends on Grafana config | ✓ fully offline-capable |
| Infrastructure needed at read time | ClickHouse + Grafana running | ✓ just a browser |
Why ClickHouse as the intermediary — rather than shipping raw log files to S3 and reading them with AWFFull directly (as in the log-shipping companion post):
- Multiple Envoy and nginx pods write to the same ClickHouse table. A single
ORDER BY timestampin SQL merges all pod streams correctly — mergelog-rs is not needed. - Structured fields in ClickHouse enable filtering the export (by namespace, status code, path prefix) before AWFFull sees it — impossible with raw log files.
- The same data serves both live investigation (Grafana SQL queries) and the monthly batch report, with no duplication.
- Cold-tier S3 data is transparently included in the SQL export without downloading and decompressing individual log files.
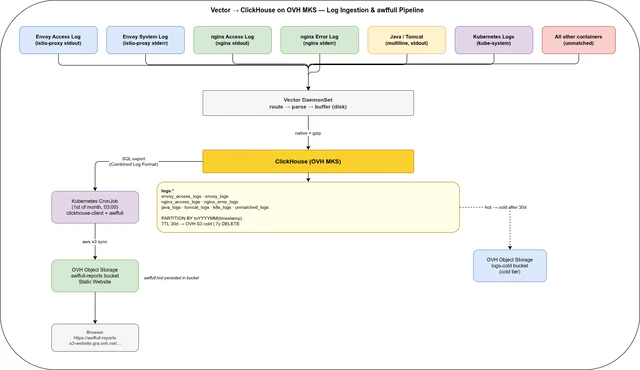
Architecture🔗
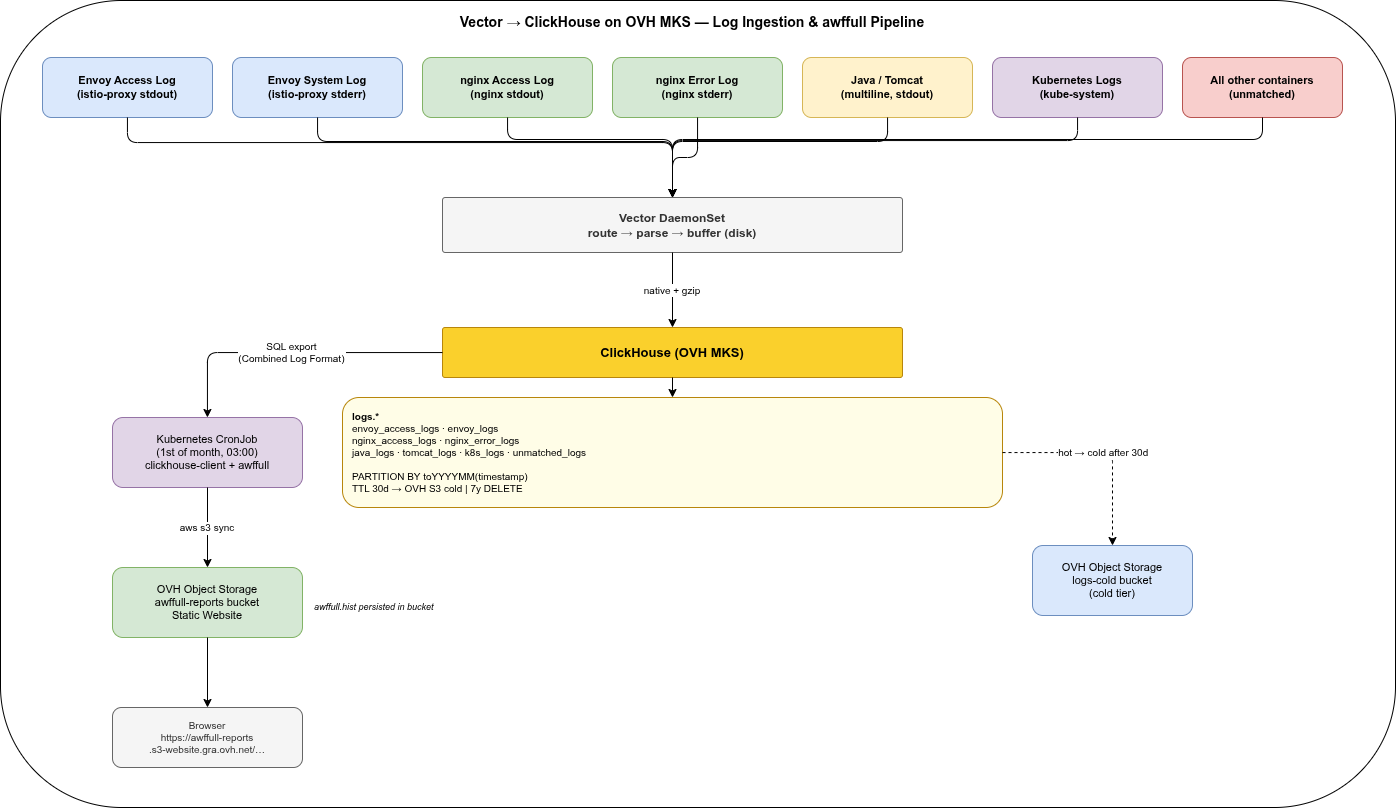
Seven log sources, one Vector DaemonSet, one ClickHouse cluster, three OVH Object Storage buckets (warm tier, cold tier, and awffull reports).
| Source | Container | Stream | Format |
|---|---|---|---|
| Envoy access log | istio-proxy | stdout | JSON (after config) |
| Envoy system log | istio-proxy | stderr | Text |
| nginx access log | nginx | stdout | Combined Log Format |
| nginx error log | nginx | stderr | nginx error format |
| Java app log | app containers | stdout | Logback text (multiline) |
| Tomcat Catalina | tomcat | stdout | Catalina text (multiline) |
| Go app / panic | go containers | stdout/stderr | JSON / logfmt / panic stacktrace (multiline) |
| Kubernetes system | kube-system pods | stdout/stderr | Mixed |
All unmatched log lines — from any container not covered by the above routes — land in a dedicated unmatched_logs table. No routed or unmatched log line is intentionally dropped; sink errors, ClickHouse unavailability, and a full host disk can still cause loss or backpressure and must be monitored.
Prerequisite: Envoy Access Log in JSON Format🔗
By default, Istio’s Envoy proxy writes access logs in text format. For structured ClickHouse ingestion, JSON encoding must be configured explicitly.
In your IstioOperator manifest or Helm values:
meshConfig:
  accessLogFile: /dev/stdout
  accessLogEncoding: JSON
After this change, the istio-proxy container stdout produces structured JSON. The example below already includes the referer field added by the Telemetry API in the next section:
{
  "start_time": "2026-05-14T10:00:00.123Z",
  "method": "GET",
  "path": "/api/v1/health",
  "protocol": "HTTP/1.1",
  "response_code": 200,
  "response_flags": "-",
  "bytes_received": 0,
  "bytes_sent": 42,
  "duration": 5,
  "x_forwarded_for": "203.0.113.1",
  "user_agent": "curl/7.88.1",
  "referer": "-",
  "request_id": "a1b2c3d4-1234-5678-abcd-ef0123456789",
  "authority": "api.example.com",
  "upstream_host": "10.0.0.5:8080",
  "upstream_cluster": "outbound|8080||svc.default.svc.cluster.local"
}
The stderr stream continues to carry Envoy system logs in text format. Vector’s kubernetes_logs source captures both, tagged with stream: "stdout" or stream: "stderr" — this is how the routing below separates access logs from system logs without any fragile regex on the message content.
Adding the Referer header via Telemetry API🔗
By default, Envoy’s JSON access log does not include the HTTP Referer header. To add it, use the Telemetry API with a custom accessLogFormat. The Telemetry API controls which workloads log and what format they use; meshConfig only sets the global default encoding.
# telemetry.istio.io/v1 is GA in Istio 1.23+; use v1alpha1 for older versions
apiVersion: telemetry.istio.io/v1alpha1
kind: Telemetry
metadata:
  name: access-log-json-referer
  namespace: istio-system   # mesh-wide; scope to a namespace or workload as needed
spec:
  accessLogging:
    - providers:
        - name: envoy
      format:
        json:
          start_time:               "%START_TIME%"
          method:                   "%REQ(:METHOD)%"
          path:                     "%REQ(X-ENVOY-ORIGINAL-PATH?:PATH)%"
          protocol:                 "%PROTOCOL%"
          response_code:            "%RESPONSE_CODE%"
          bytes_sent:               "%BYTES_SENT%"
          bytes_received:           "%BYTES_RECEIVED%"
          duration:                 "%DURATION%"
          x_forwarded_for:          "%REQ(X-FORWARDED-FOR)%"
          user_agent:               "%REQ(USER-AGENT)%"
          referer:                  "%REQ(REFERER)%"
          request_id:               "%REQ(X-REQUEST-ID)%"
          authority:                "%REQ(:AUTHORITY)%"
          upstream_host:            "%UPSTREAM_HOST%"
          upstream_cluster:         "%UPSTREAM_CLUSTER%"
          response_flags:           "%RESPONSE_FLAGS%"
          downstream_remote_address: "%DOWNSTREAM_REMOTE_ADDRESS%"
%REQ(REFERER)% outputs - when the header is absent — consistent with CLF format, as shown in the example above.
Vector Configuration🔗
Vector is installed via the official Helm chart in Agent mode. The chart deploys a DaemonSet and handles RBAC, hostPath mounts for /var/log and /var/lib/docker/containers, and injects VECTOR_SELF_NODE_NAME automatically — no manual DaemonSet manifest needed.
helm repo add vector https://helm.vector.dev
helm repo update

helm install vector vector/vector \
  --namespace logging \
  --create-namespace \
--values vector-values.yamlThe route conditions in the appendix use container names (nginx, tomcat, etc.) that must match your actual Kubernetes containerName values. Update them to reflect your deployment before applying.
The complete vector-values.yaml — all sources, transforms, and sinks — is in the appendix at the end of this post.
ClickHouse: Automation🔗
The storage policy, users, and tables in the following sections can be applied manually with clickhouse-client for a first setup. For team workflows and multiple environments, three automation layers cover the full lifecycle:
Kubernetes Cluster — clickhouse-operator🔗
clickhouse-operator by Altinity (Apache 2.0) is the standard way to run ClickHouse on Kubernetes. It manages the full cluster lifecycle via a ClickHouseInstallation CRD: shards, replicas, storage volumes, config file injection, rolling updates, and pod disruption budgets. The same company maintains clickhouse-backup and clickhouse-operator — both Apache 2.0, no enterprise tier required.
helm repo add clickhouse-operator https://docs.altinity.com/clickhouse-operator/
helm install clickhouse-operator clickhouse-operator/altinity-clickhouse-operator \
  --namespace clickhouse-operator \
  --create-namespace
A minimal ClickHouseInstallation for a single-node setup on OVH MKS:
apiVersion: "clickhouse.altinity.com/v1"
kind: ClickHouseInstallation
metadata:
  name: clickhouse
  namespace: logging
spec:
  configuration:
    clusters:
      - name: logs
        layout:
          shardsCount: 1
          replicasCount: 1
    files:
      config.d/storage.xml: |
        <!-- storage policy defined separately -->
  templates:
    volumeClaimTemplates:
      - name: data
        spec:
          accessModes: [ReadWriteOnce]
          storageClassName: csi-cinder-high-speed
          resources:
            requests:
              storage: 500Gi
Schema and Users — Terraform🔗
The Altinity Terraform provider manages ClickHouse databases, tables, users, and grants as code. This is the right tool for schema migrations in a GitOps pipeline — a table change goes through a PR, is reviewed, and applied by CI rather than run manually.
terraform
required_providers
clickhouse =
source = "Altinity/clickhouse"
version = "~> 0.3"
provider "clickhouse"
host = "clickhouse.logging.svc.cluster.local"
port = 9000
username =.clickhouse_admin_user
password =.clickhouse_admin_password
resource "clickhouse_user" "vector_writer"
name = "vector_writer"
password =.vector_password
resource "clickhouse_grant" "vector_insert"
user =.vector_writer.name
database = "logs"
privilege = "INSERT"
Schema migrations (new columns, new tables) follow the same pattern: add a clickhouse_table resource, open a PR, CI runs terraform plan in the pipeline, merge triggers terraform apply.
For ClickHouse Cloud there is a separate official provider: clickhouse/clickhouse.
Bare-Metal or VM — Ansible🔗
For non-Kubernetes deployments the community.clickhouse Ansible collection covers installation, configuration file management, database and table creation, and user management. Useful for on-prem setups or hybrid environments where some nodes run outside Kubernetes.
ClickHouse: Storage Policy🔗
Define the three-tier storage policy before creating any tables. Parts stay on hot SSD for 30 days, move to the warm OVH Object Storage bucket (Standard tier) for 30–90 days, then move to the cold bucket (Infrequent Access tier) for the remainder of the 7-year retention. OVH Infrequent Access has no retrieval fee, making it safe for searchable archival data.
<!-- /etc/clickhouse-server/config.d/storage.xml -->
<clickhouse>
  <storage_configuration>
    <disks>
      <local>
        <type>local</type>
        <path>/var/lib/clickhouse/</path>
      </local>
      <obj_warm>
        <type>object_storage</type>
        <object_storage_type>s3</object_storage_type>
        <endpoint>https://s3.gra.perf.cloud.ovh.net/logs-warm/data/</endpoint>
        <access_key_id from_env="S3_ACCESS_KEY_ID"/>
        <secret_access_key from_env="S3_SECRET_ACCESS_KEY"/>
        <metadata_path>/var/lib/clickhouse/disks/obj_warm/</metadata_path>
        <cache_enabled>true</cache_enabled>
        <cache_path>/var/lib/clickhouse/disks/obj_warm_cache/</cache_path>
        <cache_max_size>10737418240</cache_max_size>  <!-- 10 GiB: warm data queried frequently -->
      </obj_warm>
      <obj_cold>
        <type>object_storage</type>
        <object_storage_type>s3</object_storage_type>
        <endpoint>https://s3.gra.perf.cloud.ovh.net/logs-cold/data/</endpoint>
        <access_key_id from_env="S3_ACCESS_KEY_ID"/>
        <secret_access_key from_env="S3_SECRET_ACCESS_KEY"/>
        <metadata_path>/var/lib/clickhouse/disks/obj_cold/</metadata_path>
        <cache_enabled>true</cache_enabled>
        <cache_path>/var/lib/clickhouse/disks/obj_cold_cache/</cache_path>
        <cache_max_size>5368709120</cache_max_size>   <!-- 5 GiB: archive data queried rarely -->
      </obj_cold>
    </disks>
    <policies>
      <hot_to_warm_to_cold>
        <volumes>
          <hot>
            <disk>local</disk>
            <max_data_part_size_bytes>5368709120</max_data_part_size_bytes>
          </hot>
          <warm>
            <disk>obj_warm</disk>
            <prefer_not_to_merge>true</prefer_not_to_merge>
          </warm>
          <cold>
            <disk>obj_cold</disk>
            <prefer_not_to_merge>true</prefer_not_to_merge>
          </cold>
        </volumes>
        <move_factor>0.2</move_factor>
      </hot_to_warm_to_cold>
    </policies>
  </storage_configuration>
</clickhouse>
Each tier has a local read cache: 10 GiB for warm (data queried regularly via dashboards), 5 GiB for cold (archive queries benefit on repeated forensic access to the same window).
Before ClickHouse 24.3, use <type>s3</type> instead of <type>object_storage</type> and omit the <object_storage_type> line. All other settings remain identical. The classic s3 disk type is still fully supported in current ClickHouse versions.
ClickHouse: Users and Permissions🔗
Roles🔗
ClickHouse supports a full role system — grant permissions to roles, assign roles to users. This is the recommended approach as soon as more than a handful of users exist:
CREATE ROLE log_writer;
GRANT INSERT ON logs.* TO log_writer;

CREATE ROLE log_reader;
GRANT SELECT ON logs.envoy_access_logs TO log_reader;
Roles can be granted to other roles (hierarchy) and a user can hold multiple roles simultaneously.
Service Account Users🔗
Two dedicated users for this setup — Vector only needs to write, the awffull CronJob only needs to read one table:
CREATE USER IF NOT EXISTS vector_writer
    IDENTIFIED WITH sha256_password BY 'changeme-vector';
GRANT log_writer TO vector_writer;

CREATE USER IF NOT EXISTS awffull_reader
    IDENTIFIED WITH sha256_password BY 'changeme-awffull';
GRANT log_reader TO awffull_reader;
SSO: LDAP, Keycloak, Entra ID🔗
For human users — Grafana datasource access, ad-hoc SQL sessions — ClickHouse supports two SSO paths:
LDAP (mature, widely used)
ClickHouse has native LDAP authentication. Entra ID (via Entra Domain Services) and Keycloak (configured as LDAP provider) both work. LDAP groups can be mapped to ClickHouse roles:
<!-- config.d/ldap.xml -->
<clickhouse>
<ldap_servers>
<entra>
<host>ldap.your-domain.com</host>
<port>636</port>
<enable_tls>yes</enable_tls>
<bind_dn>cn={user_name},ou=users,dc=example,dc=com</bind_dn>
<role_mapping>
<base_dn>ou=groups,dc=example,dc=com</base_dn>
<attribute>cn</attribute>
<scope>subtree</scope>
<search_filter>(&(objectClass=groupOfNames)(member={bind_dn}))</search_filter>
<prefix>clickhouse_</prefix>
</role_mapping>
</entra>
</ldap_servers>
</clickhouse>-- Users authenticate with their LDAP password; role comes from LDAP group membership
CREATE USER '{ldap_user}' IDENTIFIED WITH ldap SERVER 'entra';JWT / OIDC (ClickHouse 24+)
Since ClickHouse 24, tokens from any OIDC provider (Keycloak, Entra ID) can be validated directly via the provider’s JWKS endpoint. The user passes their OIDC access token — no redirect flow, but authentication is fully delegated to the IdP:
<!-- config.d/jwt.xml -->
<clickhouse>
  <jwt_validators>
    <keycloak>
      <jwks_uri>https://keycloak.example.com/realms/myrealm/protocol/openid-connect/certs</jwks_uri>
      <claims_to_user_attribute>preferred_username</claims_to_user_attribute>
    </keycloak>
  </jwt_validators>
</clickhouse>
CREATE USER 'alice' IDENTIFIED WITH jwt VALIDATOR 'keycloak';
GRANT log_reader TO alice;For Entra ID replace jwks_uri with https://login.microsoftonline.com/{tenant-id}/discovery/v2.0/keys.
Service accounts (Vector, awffull CronJob): sha256_password + roles + ESO. Human users and Grafana datasource access: LDAP if Active Directory is already in place, JWT against Keycloak or Entra ID for a pure OIDC setup.
Reference these credentials in the Kubernetes Secrets that the Vector Helm chart and the CronJob consume:
kubectl create secret generic clickhouse-creds \
  --namespace logging \
  --from-literal=user=vector_writer \
  --from-literal=password=changeme-vector

kubectl create secret generic clickhouse-awffull-creds \
  --namespace logging \
  --from-literal=CLICKHOUSE_USER=awffull_reader \
--from-literal=CLICKHOUSE_PASSWORD=changeme-awffullThe kubectl create secret commands above are suitable for local testing. In a production cluster, secrets should never be created manually or stored in plain text in manifests. The External Secrets Operator (ESO) synchronises Kubernetes Secrets from an external secret store — HashiCorp Vault, AWS Secrets Manager, Azure Key Vault, GCP Secret Manager, or OVH Key Management Service — and keeps them up to date automatically. An ExternalSecret resource replaces the kubectl create secret call:
apiVersion: external-secrets.io/v1beta1
kind: ExternalSecret
metadata:
  name: clickhouse-creds
  namespace: logging
spec:
  refreshInterval: 1h
  secretStoreRef:
    name: vault-backend      # your SecretStore or ClusterSecretStore
    kind: ClusterSecretStore
  target:
    name: clickhouse-creds
  data:
    - secretKey: user
      remoteRef:
        key: logging/clickhouse
        property: vector_user
    - secretKey: password
      remoteRef:
        key: logging/clickhouse
        property: vector_password
ESO reconciles the Secret on every refreshInterval — a rotated password in Vault propagates to the cluster without touching any manifest or redeploying anything.
Authentication boundary between service accounts and human users🔗
ClickHouse has no built-in “service account” type — everything is a USER. The differentiation is enforced by the IDENTIFIED WITH clause: a user created with IDENTIFIED WITH ldap can only authenticate via LDAP, never with a static password, and vice versa. The authentication method is the enforcement boundary.
| User type | Authentication | Can use static password |
|---|---|---|
| Service account (Vector, awffull) | sha256_password | ✓ |
| Human / Grafana | ldap or jwt | ✗ |
A second hardening layer for service accounts is the HOST restriction — limiting connections to the cluster-internal network:
CREATE USER vector_writer
    IDENTIFIED WITH sha256_password BY 'changeme-vector'
    HOST REGEXP '.*\.logging\.svc\.cluster\.local';
Human users typically have no HOST restriction and connect via VPN or a bastion host. Combining IDENTIFIED WITH ldap/jwt for humans with HOST restrictions for service accounts gives two independent enforcement layers: authentication method and network origin.
In Kubernetes, DNS-based HOST REGEXP rules can behave unexpectedly — the client IP seen by ClickHouse is the pod IP, not the DNS name, so reverse resolution must succeed for the check to work. The more reliable primary control is a Kubernetes NetworkPolicy that only permits ingress to ClickHouse from the logging namespace (Vector, awffull CronJob). HOST REGEXP is a useful defence-in-depth addition, not a substitute.
ClickHouse: Tables🔗
All tables use PARTITION BY toYYYYMM(timestamp). This is ClickHouse’s equivalent of a monthly index: each partition is a separate on-disk unit that can be moved to cold storage, backed up, or dropped independently. Queries with a timestamp WHERE clause automatically skip irrelevant partitions.
The TTL moves parts to warm after 30 days, to cold after 90 days, and deletes after 7 years. This pattern is consistent across all tables.
logs.envoy_access_logs🔗
HTTP traffic through the Istio gateway — the primary source for web statistics.
CREATE DATABASE IF NOT EXISTS logs;
CREATE TABLE IF NOT EXISTS logs.envoy_access_logs
(
timestamp DateTime64(3, 'UTC'),
client_ip String,
method LowCardinality(String),
path String,
query String,
protocol LowCardinality(String),
status UInt16,
bytes_sent UInt64,
bytes_received UInt64,
duration_ms UInt32,
referer String,
user_agent String,
host String,
upstream_cluster LowCardinality(String),
upstream_host String,
request_id String,
response_flags LowCardinality(String),
namespace LowCardinality(String),
pod String,
node LowCardinality(String)
)
ENGINE = MergeTree
PARTITION BY toYYYYMM(timestamp)
ORDER BY (toDate(timestamp), status, client_ip)
TTL
toDateTime(timestamp) + INTERVAL 30 DAY TO VOLUME 'warm',
toDateTime(timestamp) + INTERVAL 90 DAY TO VOLUME 'cold',
toDateTime(timestamp) + INTERVAL 7 YEAR DELETE
SETTINGS storage_policy = 'hot_to_warm_to_cold';logs.envoy_logs🔗
Envoy system log: connection events, upstream health changes, configuration updates, errors.
CREATE TABLE IF NOT EXISTS logs.envoy_logs
(
timestamp DateTime64(3, 'UTC'),
level LowCardinality(String),
component LowCardinality(String),
thread_id String,
connection_id String,
message String,
namespace LowCardinality(String),
pod String,
node LowCardinality(String)
)
ENGINE = MergeTree
PARTITION BY toYYYYMM(timestamp)
ORDER BY (toDate(timestamp), level, component)
TTL
toDateTime(timestamp) + INTERVAL 30 DAY TO VOLUME 'warm',
toDateTime(timestamp) + INTERVAL 90 DAY TO VOLUME 'cold',
toDateTime(timestamp) + INTERVAL 7 YEAR DELETE
SETTINGS storage_policy = 'hot_to_warm_to_cold';logs.nginx_access_logs🔗
nginx access log in Combined Log Format. Parallel to envoy_access_logs — can be fed to awffull with the same SQL export pattern.
CREATE TABLE IF NOT EXISTS logs.nginx_access_logs
(
timestamp DateTime64(3, 'UTC'),
client_ip String,
method LowCardinality(String),
path String,
query String,
protocol LowCardinality(String),
status UInt16,
bytes_sent UInt64,
referer String,
user_agent String,
namespace LowCardinality(String),
pod String,
node LowCardinality(String)
)
ENGINE = MergeTree
PARTITION BY toYYYYMM(timestamp)
ORDER BY (toDate(timestamp), status, client_ip)
TTL
toDateTime(timestamp) + INTERVAL 30 DAY TO VOLUME 'warm',
toDateTime(timestamp) + INTERVAL 90 DAY TO VOLUME 'cold',
toDateTime(timestamp) + INTERVAL 7 YEAR DELETE
SETTINGS storage_policy = 'hot_to_warm_to_cold';logs.nginx_error_logs🔗
CREATE TABLE IF NOT EXISTS logs.nginx_error_logs
(
timestamp DateTime64(3, 'UTC'),
level LowCardinality(String),
pid UInt32,
tid UInt32,
message String,
namespace LowCardinality(String),
pod String,
node LowCardinality(String)
)
ENGINE = MergeTree
PARTITION BY toYYYYMM(timestamp)
ORDER BY (toDate(timestamp), level)
TTL
toDateTime(timestamp) + INTERVAL 30 DAY TO VOLUME 'warm',
toDateTime(timestamp) + INTERVAL 90 DAY TO VOLUME 'cold',
toDateTime(timestamp) + INTERVAL 7 YEAR DELETE
SETTINGS storage_policy = 'hot_to_warm_to_cold';logs.java_logs🔗
Logback/Log4j2 format with multiline stacktrace support. The exception column holds the full stacktrace as a newline-joined string after Vector’s multiline reduce.
CREATE TABLE IF NOT EXISTS logs.java_logs
(
timestamp DateTime64(3, 'UTC'),
level LowCardinality(String),
logger LowCardinality(String),
thread String,
message String,
exception String,
namespace LowCardinality(String),
pod String,
container LowCardinality(String),
node LowCardinality(String)
)
ENGINE = MergeTree
PARTITION BY toYYYYMM(timestamp)
ORDER BY (toDate(timestamp), level, logger)
TTL
toDateTime(timestamp) + INTERVAL 30 DAY TO VOLUME 'warm',
toDateTime(timestamp) + INTERVAL 90 DAY TO VOLUME 'cold',
toDateTime(timestamp) + INTERVAL 7 YEAR DELETE
SETTINGS storage_policy = 'hot_to_warm_to_cold';logs.tomcat_logs🔗
Tomcat Catalina format: 14-May-2026 10:00:00.123 INFO [main] org.apache.catalina...
CREATE TABLE IF NOT EXISTS logs.tomcat_logs
(
timestamp DateTime64(3, 'UTC'),
level LowCardinality(String),
thread String,
logger LowCardinality(String),
message String,
exception String,
namespace LowCardinality(String),
pod String,
node LowCardinality(String)
)
ENGINE = MergeTree
PARTITION BY toYYYYMM(timestamp)
ORDER BY (toDate(timestamp), level)
TTL
toDateTime(timestamp) + INTERVAL 30 DAY TO VOLUME 'warm',
toDateTime(timestamp) + INTERVAL 90 DAY TO VOLUME 'cold',
toDateTime(timestamp) + INTERVAL 7 YEAR DELETE
SETTINGS storage_policy = 'hot_to_warm_to_cold';logs.go_logs🔗
Handles Go applications using log/slog (JSON or text), zerolog, zap, the standard library log package, and panic stacktraces. The stacktrace column holds the full goroutine dump when a panic occurs.
CREATE TABLE IF NOT EXISTS logs.go_logs
(
timestamp DateTime64(3, 'UTC'),
level LowCardinality(String),
message String,
stacktrace String,
namespace LowCardinality(String),
pod String,
container LowCardinality(String),
node LowCardinality(String)
)
ENGINE = MergeTree
PARTITION BY toYYYYMM(timestamp)
ORDER BY (toDate(timestamp), level)
TTL
toDateTime(timestamp) + INTERVAL 30 DAY TO VOLUME 'warm',
toDateTime(timestamp) + INTERVAL 90 DAY TO VOLUME 'cold',
toDateTime(timestamp) + INTERVAL 7 YEAR DELETE
SETTINGS storage_policy = 'hot_to_warm_to_cold';logs.k8s_logs🔗
kube-system and Kubernetes event logs. Format varies by component — stored as raw message with metadata.
CREATE TABLE IF NOT EXISTS logs.k8s_logs
(
timestamp DateTime64(3, 'UTC'),
message String,
stream LowCardinality(String),
namespace LowCardinality(String),
pod String,
container LowCardinality(String),
node LowCardinality(String)
)
ENGINE = MergeTree
PARTITION BY toYYYYMM(timestamp)
ORDER BY (toDate(timestamp), namespace, container)
TTL
toDateTime(timestamp) + INTERVAL 30 DAY TO VOLUME 'warm',
toDateTime(timestamp) + INTERVAL 90 DAY TO VOLUME 'cold',
toDateTime(timestamp) + INTERVAL 7 YEAR DELETE
SETTINGS storage_policy = 'hot_to_warm_to_cold';logs.unmatched_logs🔗
Every log line that does not match any of the routes above lands here. No line is dropped. Monitor this table — a spike means a new container type appeared or a transform broke.
CREATE TABLE IF NOT EXISTS logs.unmatched_logs
(
timestamp DateTime64(3, 'UTC'),
message String,
stream LowCardinality(String),
namespace LowCardinality(String),
pod String,
container LowCardinality(String),
node LowCardinality(String),
file String
)
ENGINE = MergeTree
PARTITION BY toYYYYMM(timestamp)
ORDER BY (toDate(timestamp), namespace, container)
TTL
toDateTime(timestamp) + INTERVAL 30 DAY TO VOLUME 'warm',
toDateTime(timestamp) + INTERVAL 90 DAY TO VOLUME 'cold',
toDateTime(timestamp) + INTERVAL 7 YEAR DELETE
SETTINGS storage_policy = 'hot_to_warm_to_cold';Alert query for the unmatched table:
SELECT
toDate(timestamp) AS day,
container,
namespace,
count() AS lines
FROM logs.unmatched_logs
WHERE timestamp >= now - INTERVAL 24 HOUR
GROUP BY day, container, namespace
ORDER BY lines DESC
LIMIT 20;Use Case: Monthly awffull Report from Envoy Logs🔗
awffull reads web server access logs in Combined Log Format. The Envoy access data in ClickHouse was ingested as structured fields — to feed awffull, reconstruct the Combined Log Format line on the fly with a SQL query.
SQL: Reconstruct Combined Log Format🔗
-- Export previous month's Envoy access log in Combined Log Format
-- Run via: clickhouse-client --query="$(cat export.sql)" > /tmp/envoy-YYYYMM.log

SELECT concat(
    client_ip, ' - - [',
    formatDateTime(timestamp, '%d/%b/%Y:%H:%M:%S +0000', 'UTC'), '] "',
    method, ' ',
    path,
    if(query != '', concat('?', query), ''),
    ' ', protocol, '" ',
    toString(status), ' ',
    toString(bytes_sent), ' "',
    if(referer != '' AND referer != '-', referer, '-'), '" "',
    if(user_agent != '', user_agent, '-'), '"'
)
FROM logs.envoy_access_logs
WHERE toYYYYMM(timestamp) = {yyyymm:UInt32}
ORDER BY timestamp
FORMAT LineAsString
client_ip already holds the resolved client address: Vector’s parse_envoy_access transform takes the first IP from x_forwarded_for (the real client behind a load balancer or proxy) and falls back to downstream_remote_address when the header is absent. No further XFF handling is needed in the SQL export.
The toYYYYMM filter in the WHERE clause restricts the query to a single partition — ClickHouse reads only that month’s data files, whether they are on hot SSD or cold OVH Object Storage.
UTC is guaranteed end-to-end: Envoy writes ISO 8601 timestamps with a Z suffix, Vector parses them as UTC, and the column is declared DateTime64(3, 'UTC'). The explicit 'UTC' third argument to formatDateTime is redundant given the column type but makes the intent clear — +0000 in the format string is always correct.
Kubernetes CronJob🔗
The CronJob runs on the 1st of each month at 03:00 and processes the previous month. It follows the stateless S3 pipeline described in Shipping Web Server Access Logs to S3: the awffull.hist state file lives in the reports bucket alongside the HTML output, so no persistent volume is needed.
# awffull-cronjob.yaml
apiVersion: v1
kind: ConfigMap
metadata:
  name: awffull-script
  namespace: logging
data:
  run.sh: |
    #!/bin/sh
    set -e

    # Previous month as YYYYMM integer (e.g. 202604)
    YYYYMM=$(date -d "last month" +%Y%m)
    YYYY=$(date -d "last month" +%Y)
    MM=$(date -d "last month" +%m)

    REPORTS_DIR="/tmp/reports"
    LOG_FILE="/tmp/envoy-${YYYYMM}.log"
    HIST_FILE="/tmp/awffull.hist"
    S3_REPORTS="s3://${REPORTS_BUCKET}/awffull"

    mkdir -p "${REPORTS_DIR}"

    # 1. Restore history file from S3 (allows incremental processing)
    aws s3 cp "${S3_REPORTS}/awffull.hist" "${HIST_FILE}" 2>/dev/null || true

    # 2. Export previous month from ClickHouse as Combined Log Format
    clickhouse-client \
      --host="${CLICKHOUSE_HOST}" \
      --user="${CLICKHOUSE_USER}" \
      --password="${CLICKHOUSE_PASSWORD}" \
      --query="
        SELECT concat(
            client_ip, ' - - [',
            formatDateTime(toTimeZone(timestamp, 'UTC'), '%d/%b/%Y:%H:%M:%S +0000', 'UTC'), '] \"',
            method, ' ', path,
            if(query != '', concat('?', query), ''),
            ' ', protocol, '\" ',
            toString(status), ' ',
            toString(bytes_sent), ' \"',
            if(referer != '' AND referer != '-', referer, '-'), '\" \"',
            if(user_agent != '', user_agent, '-'), '\"'
        )
        FROM logs.envoy_access_logs
        WHERE toYYYYMM(timestamp) = ${YYYYMM}
        ORDER BY timestamp
        FORMAT LineAsString
      " > "${LOG_FILE}"

    # 3. Run awffull
    awffull \
      -c /etc/awffull/awffull.conf \
      -o "${REPORTS_DIR}" \
      -n "Istio Gateway — ${YYYY}-${MM}" \
      -p "${HIST_FILE}" \
      "${LOG_FILE}"

    # 4. Persist updated history file to S3
    aws s3 cp "${HIST_FILE}" "${S3_REPORTS}/awffull.hist"

    # 5. Sync HTML + PNG reports to S3 reports bucket
    aws s3 sync "${REPORTS_DIR}/" "${S3_REPORTS}/${YYYY}/${MM}/" \
      --delete \
      --endpoint-url "https://s3.gra.perf.cloud.ovh.net"

    echo "Report available at: ${S3_REPORTS}/${YYYY}/${MM}/index.html"
---
apiVersion: batch/v1
kind: CronJob
metadata:
  name: awffull-monthly
  namespace: logging
spec:
  schedule: "0 3 1 * *"
  successfulJobsHistoryLimit: 3
  failedJobsHistoryLimit: 3
  jobTemplate:
    spec:
      template:
        spec:
          restartPolicy: OnFailure
          containers:
            - name: awffull
              image: registry.gitlab.com/aleks001/awffull:latest
              command: ["/bin/sh", "/scripts/run.sh"]
              env:
                - name: CLICKHOUSE_HOST
                  value: clickhouse.logging.svc.cluster.local
                - name: CLICKHOUSE_USER
                  valueFrom:
                    secretKeyRef:
                      name: clickhouse-awffull-creds
                      key: CLICKHOUSE_USER
                - name: CLICKHOUSE_PASSWORD
                  valueFrom:
                    secretKeyRef:
                      name: clickhouse-awffull-creds
                      key: CLICKHOUSE_PASSWORD
                - name: REPORTS_BUCKET
                  value: awffull-reports
                - name: AWS_DEFAULT_REGION
                  value: gra
                - name: AWS_ENDPOINT_URL
                  value: https://s3.gra.perf.cloud.ovh.net
              envFrom:
                - secretRef:
                    name: ovh-s3-creds   # AWS_ACCESS_KEY_ID, AWS_SECRET_ACCESS_KEY
              volumeMounts:
                - name: script
                  mountPath: /scripts
                - name: awffull-config
                  mountPath: /etc/awffull
          volumes:
            - name: script
              configMap:
                name: awffull-script
                defaultMode: 0755
            - name: awffull-config
              configMap:
                name: awffull-config
awffull.conf ConfigMap🔗
The CronJob mounts awffull-config at /etc/awffull. Create the ConfigMap with a minimal awffull.conf — output directory, history file, and hostname are all passed as CLI flags, so the config only needs to declare what counts as a “page” and a few rendering options:
apiVersion: v1
kind: ConfigMap
metadata:
  name: awffull-config
  namespace: logging
data:
  awffull.conf: |
    # Extensions that count as pages (not just hits)
    PageType  htm*
    PageType  html
    PageType  php
    PageType  api

    # Hide referrals from your own domain
    HideReferrer  blog.none.at

    # Link generation
    UseHTTPS  yes

    # GeoIP country lookup (free, no registration): https://db-ip.com/db/download/ip-to-country-lite
    # GeoDBPath  /etc/awffull/dbip-country-lite.mmdb

    Quiet  yes
Mount it alongside the script ConfigMap — the CronJob volume definition already references awffull-config by name (see above).
OVH Object Storage: Static Website for Reports🔗
Enable static website hosting on the reports bucket so the HTML output is directly accessible via a public URL. Create the bucket as Standard tier — reports are served directly to browsers and must be immediately available; Infrequent Access is designed for archival data, not public-facing static websites.
# Create the reports bucket as Standard tier (public-facing static website)
aws s3api create-bucket \
  --bucket awffull-reports \
  --endpoint-url https://s3.gra.perf.cloud.ovh.net

# Enable static website hosting
aws s3api put-bucket-website \
  --bucket awffull-reports \
  --endpoint-url https://s3.gra.perf.cloud.ovh.net \
  --website-configuration '{
    "IndexDocument": {"Suffix": "index.html"},
    "ErrorDocument": {"Key": "error.html"}
  }'

# Allow public read for HTML reports; deny anonymous access to the awffull.hist state file.
# The Condition restricts the Deny to unauthenticated (anonymous) requests only —
# the CronJob authenticates with its S3 credentials and is not affected.
aws s3api put-bucket-policy \
  --bucket awffull-reports \
  --endpoint-url https://s3.gra.perf.cloud.ovh.net \
  --policy '{
    "Version": "2012-10-17",
    "Statement": [
      {
        "Effect": "Allow",
        "Principal": "*",
        "Action": "s3:GetObject",
        "Resource": "arn:aws:s3:::awffull-reports/*"
      },
      {
        "Effect": "Deny",
        "Principal": "*",
        "Action": "s3:GetObject",
        "Resource": "arn:aws:s3:::awffull-reports/*.hist",
        "Condition": {
          "StringEquals": {
            "aws:PrincipalType": "Anonymous"
          }
        }
      }
    ]
  }'
The Deny statement on *.hist blocks anonymous public access to awffull/awffull.hist. The aws:PrincipalType: Anonymous condition is essential: a Deny without a condition applies to all principals including authenticated ones — the CronJob would then be unable to restore the history file on subsequent runs, causing awffull to reprocess from scratch each month. The awffull.conf is mounted from a Kubernetes ConfigMap (-c /etc/awffull/awffull.conf) and is never synced to S3.
After the first CronJob run, the report is available at:
https://awffull-reports.s3-website.gra.perf.cloud.ovh.net/awffull/2026/04/index.htmlNo web server, no nginx pod, no persistent volume — the bucket serves the HTML directly.
AWFFull reports include IP addresses, user agents, referrers, and visited paths. Before making the bucket public, verify that this is consistent with your privacy policy and applicable regulations (GDPR, etc.). Alternatives if public access is not appropriate: keep the bucket private and use pre-signed URLs for sharing, or place a reverse proxy with authentication in front of the S3 static website endpoint.
FAQ🔗
How do I add Caddy as a new log source?🔗
Create the ClickHouse table:
CREATE TABLE IF NOT EXISTS logs.caddy_access_logs
(
timestamp DateTime64(3, 'UTC'),
client_ip String,
method LowCardinality(String),
path String,
query String,
protocol LowCardinality(String),
status UInt16,
bytes_sent UInt64,
duration_ms UInt32,
referer String,
user_agent String,
host LowCardinality(String),
namespace LowCardinality(String),
pod String,
node LowCardinality(String)
)
ENGINE = MergeTree
PARTITION BY toYYYYMM(timestamp)
ORDER BY (toDate(timestamp), status, client_ip)
TTL
toDateTime(timestamp) + INTERVAL 30 DAY TO VOLUME 'warm',
toDateTime(timestamp) + INTERVAL 90 DAY TO VOLUME 'cold',
toDateTime(timestamp) + INTERVAL 7 YEAR DELETE
SETTINGS storage_policy = 'hot_to_warm_to_cold';Add the route condition (Caddy logs in JSON format by default):
route:
  caddy: '.kubernetes.container_name == "caddy"'
Add the parse transform (Caddy JSON fields: ts, request.method, request.uri, status, size, duration, request.headers.Referer, request.headers.User-Agent) and the corresponding ClickHouse sink. No other part of the config changes.
Why use disk buffers on every sink?🔗
The buffer.type: disk with when_full: block means Vector writes to local disk rather than dropping events when ClickHouse is temporarily unavailable (restart, rolling update, brief network issue). The 1 GiB per sink is large enough to absorb an extended outage without dropping events. Without disk buffers, a 2-minute ClickHouse pod restart during a node drain would silently drop all logs generated during that window.
With 9 sinks at 1 GiB each, the hostPath /var/lib/vector can grow up to 9 GiB in a worst-case sustained outage. Plan node disk capacity accordingly — the path is mounted via extraVolumes.hostPath with no upper size limit.
What happens when a parse transform encounters an unexpected format?🔗
Three paths exist depending on where the failure occurs:
| Failure mode | Trigger | Destination |
|---|---|---|
| Route miss | Container name matches no route branch | _unmatched → unmatched_logs |
| Parse abort | abort in parse_envoy_access / parse_nginx_access | .dropped → enrich_unmatched → unmatched_logs |
| Graceful fallback | drop_on_error: false without abort | Passes through with empty / default field values |
Route misses land in _unmatched automatically — no extra config needed.
Parse aborts do not fall back to _unmatched; that output belongs to the route transform only. The two access log transforms use drop_on_abort: true + reroute_dropped: true: aborted events are dropped from the normal output and redirected to the .dropped named output, which is wired into enrich_unmatched alongside _unmatched — so they reach unmatched_logs rather than being silently discarded or forwarded to ClickHouse with missing fields.
Graceful fallbacks pass the event downstream with best-effort field extraction — empty strings or zeros where parsing failed. These never reach unmatched_logs.
Check unmatched_logs for the raw message and the container field to identify which source is producing unexpected formats.
How do I generate the awffull report in a local timezone instead of UTC?🔗
All timestamps are stored as DateTime64(3, 'UTC') in ClickHouse. To produce a report in a different timezone, change two things in the SQL export query.
1. Convert and format in the target timezone:
-- Tokyo (UTC+9, no DST)
formatDateTime(toTimeZone(timestamp, 'Asia/Tokyo'), '%d/%b/%Y:%H:%M:%S %z', 'Asia/Tokyo')

-- New York (DST-aware: %z outputs -0500 or -0400 automatically)
formatDateTime(toTimeZone(timestamp, 'America/New_York'), '%d/%b/%Y:%H:%M:%S %z', 'America/New_York')
%z outputs the actual UTC offset (+0900, -0500, etc.) rather than a hardcoded literal — important for DST-observing timezones.
2. Adjust the WHERE clause to cover the correct local-time month boundary:
toYYYYMM(timestamp) = 202604 works on UTC. The last few hours of April UTC are already May 1st in Tokyo, and vice versa. Use explicit timezone-aware boundaries instead:
WHERE timestamp >= toDateTime('2026-04-01 00:00:00', 'Asia/Tokyo')
  AND timestamp <  toDateTime('2026-05-01 00:00:00', 'Asia/Tokyo')
ORDER BY timestamp
FORMAT LineAsString
ClickHouse converts these bounds to UTC internally. The awffull report will then reflect local midnight-to-midnight for the month, and all “peak hour” statistics will be in local time.
How do I verify that no logs are being dropped?🔗
Vector exposes internal metrics. Check the component_sent_events_total and component_errors_total counters per component. A Prometheus scrape config for the Vector pod:
- job_name: vector
  static_configs:
    - targets: ['vector.logging.svc.cluster.local:9598']
Key metrics to alert on:
vector_component_errors_total— parse or sink errorsvector_buffer_discarded_events_total— events dropped when buffer is full (should be zero withwhen_full: block)logs.unmatched_logsrow count increasing faster than expected
Appendix: vector-values.yaml🔗
The entire Vector pipeline lives under customConfig: in the Helm values file. The Helm chart renders this into a ConfigMap — no separate vector.yaml to maintain.
# vector-values.yaml
role: Agent

tolerations:
  - operator: Exists

resources:
  requests:
    cpu: 100m
    memory: 256Mi
  limits:
    cpu: 500m
    memory: 512Mi

env:
  - name: CLICKHOUSE_USER
    valueFrom:
      secretKeyRef:
        name: clickhouse-creds
        key: user
  - name: CLICKHOUSE_PASSWORD
    valueFrom:
      secretKeyRef:
        name: clickhouse-creds
        key: password

# On-disk buffer volume — survives ClickHouse restarts without dropping events
extraVolumes:
  - name: vector-data
    hostPath:
      path: /var/lib/vector
      type: DirectoryOrCreate

extraVolumeMounts:
  - name: vector-data
    mountPath: /var/lib/vector

customConfig:
  sources:
    kubernetes_logs:
      type: kubernetes_logs
      use_apiserver_cache: true
      self_node_name: "${VECTOR_SELF_NODE_NAME}"
      exclude_paths_glob_patterns:
        - /var/log/pods/logging_vector-*/**

  transforms:
    # ── Step 1: Route by container name and stream ─────────────────────────
    route_source:
      type: route
      inputs: [kubernetes_logs]
      route:
        envoy_access: >-
          .kubernetes.container_name == "istio-proxy" &&
          .stream == "stdout"
        envoy_system: >-
          .kubernetes.container_name == "istio-proxy" &&
          .stream == "stderr"
        nginx_access: >-
          .kubernetes.container_name == "nginx" &&
          .kubernetes.pod_namespace != "kube-system" &&
          .stream == "stdout"
        nginx_error: >-
          .kubernetes.container_name == "nginx" &&
          .kubernetes.pod_namespace != "kube-system" &&
          .stream == "stderr"
        java: >-
          includes(["app", "backend", "api", "service"], .kubernetes.container_name) &&
          .kubernetes.pod_namespace != "kube-system"
        tomcat: >-
          includes(["tomcat", "catalina"], .kubernetes.container_name) &&
          .kubernetes.pod_namespace != "kube-system"
        golang: >-
          includes(["go-app", "go-service", "go-api"], .kubernetes.container_name) &&
          .kubernetes.pod_namespace != "kube-system"
        k8s_system: >-
          .kubernetes.pod_namespace == "kube-system"

    # ── Step 2: Parse transforms ────────────────────────────────────────────

    parse_envoy_access:
      type: remap
      inputs: [route_source.envoy_access]
      drop_on_abort: true
      reroute_dropped: true
      source: |
        parsed, err = parse_json(.message)
        if err != null { abort }

        .timestamp = parse_timestamp!(to_string(get!(parsed, ["start_time"]) ?? ""), "%+") ?? now()

        xfwd = to_string(get(parsed, ["x_forwarded_for"]) ?? "") ?? ""
        if xfwd != "" {
          .client_ip = strip_whitespace(split(xfwd, ",")[0] ?? xfwd)
        } else {
          downstream = to_string(get(parsed, ["downstream_remote_address"]) ?? "") ?? ""
          .client_ip = split(downstream, ":")[0] ?? downstream
        }

        .method = to_string(get(parsed, ["method"]) ?? "") ?? "-"
        full_path = to_string(get(parsed, ["path"]) ?? "") ?? "/"
        pq = split(full_path, "?", limit: 2)
        .path = pq[0]
        .query = if length(pq) > 1 { pq[1] } else { "" }
        .protocol = to_string(get(parsed, ["protocol"]) ?? "") ?? "-"
        .status = to_int(get(parsed, ["response_code"]) ?? 0) ?? 0
        .bytes_sent = to_int(get(parsed, ["bytes_sent"]) ?? 0) ?? 0
        .bytes_received = to_int(get(parsed, ["bytes_received"]) ?? 0) ?? 0
        .duration_ms = to_int(get(parsed, ["duration"]) ?? 0) ?? 0
        .referer = to_string(get(parsed, ["referer"]) ?? "") ?? ""
        .user_agent = to_string(get(parsed, ["user_agent"]) ?? "") ?? ""
        .host = to_string(get(parsed, ["authority"]) ?? "") ?? ""
        .upstream_cluster = to_string(get(parsed, ["upstream_cluster"]) ?? "") ?? ""
        .upstream_host = to_string(get(parsed, ["upstream_host"]) ?? "") ?? ""
        .request_id = to_string(get(parsed, ["request_id"]) ?? "") ?? ""
        .response_flags = to_string(get(parsed, ["response_flags"]) ?? "") ?? ""

        .namespace = .kubernetes.pod_namespace
        .pod = .kubernetes.pod_name
        .node = .kubernetes.node_name

        del(.message); del(.kubernetes); del(.stream); del(.file); del(.source_type)

    parse_envoy_system:
      type: remap
      inputs: [route_source.envoy_system]
      drop_on_error: false
      source: |
        # Format: [2026-05-14 10:00:00.123][15][warning][upstream] [file.cc:163] message
        parsed, err = parse_regex(.message,
          r'^\[(?P<ts>[^\]]+)\]\[(?P<tid>\d+)\]\[(?P<level>[^\]]+)\]\[(?P<component>[^\]]+)\] \[[^\]]+\] (?P<msg>.+)$')
        if err != null || parsed == null {
          .level = "unknown"; .component = "unknown"; .thread_id = ""; .connection_id = ""
        } else {
          .timestamp = parse_timestamp(to_string(parsed.ts) ?? "", "%Y-%m-%d %H:%M:%S%.f") ?? now()
          .level = to_string(parsed.level) ?? "unknown"
          .component = to_string(parsed.component) ?? "unknown"
          .thread_id = to_string(parsed.tid) ?? ""
          conn, _ = parse_regex(to_string(parsed.msg) ?? "", r'^\[C(?P<cid>\d+)\] ')
          .connection_id = if conn != null { to_string(conn.cid) ?? "" } else { "" }
          .message = to_string(parsed.msg) ?? .message
        }

        .namespace = .kubernetes.pod_namespace
        .pod = .kubernetes.pod_name
        .node = .kubernetes.node_name

        del(.kubernetes); del(.stream); del(.file); del(.source_type)

    parse_nginx_access:
      type: remap
      inputs: [route_source.nginx_access]
      drop_on_abort: true
      reroute_dropped: true
      source: |
        parsed, err = parse_nginx_log(.message, format: "combined")
        if err != null { abort }

        .timestamp = parse_timestamp!(to_string(parsed.timestamp) ?? "", "%d/%b/%Y:%H:%M:%S %z") ?? now()
        .client_ip = to_string(parsed.client) ?? "-"

        req = to_string(parsed.request) ?? "- - -"
        parts = split(req, " ")
        .method = if length(parts) >= 1 { parts[0] } else { "-" }
        path_query = if length(parts) >= 2 { parts[1] } else { "/" }
        .protocol = if length(parts) >= 3 { parts[2] } else { "-" }
        pq = split(path_query, "?", limit: 2)
        .path = pq[0]
        .query = if length(pq) > 1 { pq[1] } else { "" }

        .status = to_int(parsed.status) ?? 0
        .bytes_sent = to_int(parsed.size) ?? 0
        .referer = to_string(parsed.referer) ?? ""
        .user_agent = to_string(parsed.agent) ?? ""

        .namespace = .kubernetes.pod_namespace
        .pod = .kubernetes.pod_name
        .node = .kubernetes.node_name

        del(.message); del(.kubernetes); del(.stream); del(.file); del(.source_type)

    parse_nginx_error:
      type: remap
      inputs: [route_source.nginx_error]
      drop_on_error: false
      source: |
        # Format: 2026/05/14 10:00:00 [error] 15#15: *1 message
        parsed, err = parse_nginx_log(.message, format: "error")
        if err != null {
          .level = "unknown"; .pid = 0; .tid = 0
        } else {
          .timestamp = parse_timestamp(to_string(parsed.timestamp) ?? "", "%Y/%m/%d %H:%M:%S") ?? now()
          .level = to_string(parsed.severity) ?? "unknown"
          .pid = to_int(parsed.pid) ?? 0
          .tid = to_int(parsed.tid) ?? 0
          .message = to_string(parsed.message) ?? .message
        }

        .namespace = .kubernetes.pod_namespace
        .pod = .kubernetes.pod_name
        .node = .kubernetes.node_name

        del(.kubernetes); del(.stream); del(.file); del(.source_type)

    multiline_java:
      type: reduce
      inputs: [route_source.java]
      group_by:
        - .kubernetes.pod_name
        - .kubernetes.container_name
      merge_strategies:
        message: concat_newline
      starts_when:
        type: vrl
        source: >-
          match(string!(.message), r'^\d{4}-\d{2}-\d{2}[ T]\d{2}:\d{2}:\d{2}')
      expire_after_ms: 2000

    parse_java:
      type: remap
      inputs: [multiline_java]
      drop_on_error: false
      source: |
        lines = split(.message, "\n")
        first = lines[0] ?? ""

        parsed, err = parse_regex(first,
          r'^(?P<ts>\d{4}-\d{2}-\d{2}[ T]\d{2}:\d{2}:\d{2}[.,]\d+)\s+(?P<level>\w+)\s+(?:\d+\s+---\s+)?\[(?P<thread>[^\]]+)\]\s+(?P<logger>\S+)\s*[:\-]\s*(?P<msg>.+)$')

        if err != null || parsed == null {
          .level = "unknown"; .logger = "unknown"; .thread = ""; .message = first
        } else {
          .timestamp = parse_timestamp(replace(to_string(parsed.ts) ?? "", ",", "."),
                         "%Y-%m-%d %H:%M:%S%.f") ?? now()
          .level = to_string(parsed.level) ?? "unknown"
          .logger = to_string(parsed.logger) ?? "unknown"
          .thread = to_string(parsed.thread) ?? ""
          .message = to_string(parsed.msg) ?? first
        }

        .exception = if length(lines) > 1 {
          join(slice!(lines, 1) ?? [], "\n")
        } else { "" }

        .namespace = .kubernetes.pod_namespace
        .pod = .kubernetes.pod_name
        .container = .kubernetes.container_name
        .node = .kubernetes.node_name

        del(.kubernetes); del(.stream); del(.file); del(.source_type)

    multiline_tomcat:
      type: reduce
      inputs: [route_source.tomcat]
      group_by:
        - .kubernetes.pod_name
      merge_strategies:
        message: concat_newline
      starts_when:
        type: vrl
        source: >-
          match(string!(.message), r'^\d{2}-\w{3}-\d{4} \d{2}:\d{2}:\d{2}\.\d+')
      expire_after_ms: 2000

    parse_tomcat:
      type: remap
      inputs: [multiline_tomcat]
      drop_on_error: false
      source: |
        lines = split(.message, "\n")
        first = lines[0] ?? ""

        parsed, err = parse_regex(first,
          r'^(?P<ts>\d{2}-\w{3}-\d{4} \d{2}:\d{2}:\d{2}\.\d+)\s+(?P<level>\w+)\s+\[(?P<thread>[^\]]+)\]\s+(?P<logger>\S+)\s+(?P<msg>.+)$')

        if err != null || parsed == null {
          .level = "unknown"; .logger = "unknown"; .thread = ""; .message = first
        } else {
          .timestamp = parse_timestamp(to_string(parsed.ts) ?? "",
                         "%d-%b-%Y %H:%M:%S%.f") ?? now()
          .level = to_string(parsed.level) ?? "unknown"
          .logger = to_string(parsed.logger) ?? "unknown"
          .thread = to_string(parsed.thread) ?? ""
          .message = to_string(parsed.msg) ?? first
        }

        .exception = if length(lines) > 1 {
          join(slice!(lines, 1) ?? [], "\n")
        } else { "" }

        .namespace = .kubernetes.pod_namespace
        .pod = .kubernetes.pod_name
        .node = .kubernetes.node_name

        del(.kubernetes); del(.stream); del(.file); del(.source_type)

    multiline_golang:
      type: reduce
      inputs: [route_source.golang]
      group_by:
        - .kubernetes.pod_name
        - .kubernetes.container_name
      merge_strategies:
        message: concat_newline
      starts_when:
        type: vrl
        source: >-
          match(string!(.message),
            r'^(\d{4}[-/]\d{2}[-/]\d{2}[T ]\d{2}:\d{2}:\d{2}|panic:|goroutine \d+ \[)')
      expire_after_ms: 2000

    parse_golang:
      type: remap
      inputs: [multiline_golang]
      drop_on_error: false
      source: |
        lines = split(.message, "\n")
        first = lines[0] ?? ""
        rest = if length(lines) > 1 { join(slice!(lines, 1) ?? [], "\n") } else { "" }

        # Panic output: starts with "panic:" — entire block is the stacktrace
        if starts_with(first, "panic:") {
          .level = "panic"
          .message = first
          .stacktrace = rest
          .timestamp = now()
        } else {
          # Try JSON (zerolog / zap / log/slog JSON)
          parsed_json, err = parse_json(first)
          if err == null && is_object(parsed_json) {
            .level = downcase(
              to_string(get(parsed_json, ["level"]) ?? get(parsed_json, ["Level"]) ?? "") ?? ""
            ) ?? ""
            .message = to_string(
              get(parsed_json, ["msg"]) ?? get(parsed_json, ["message"]) ?? first
            ) ?? first
            ts_str = to_string(get(parsed_json, ["time"]) ?? get(parsed_json, ["ts"]) ?? "") ?? ""
            .timestamp = if ts_str != "" { parse_timestamp!(ts_str, "%+") } else { now() }
            .stacktrace = to_string(get(parsed_json, ["stacktrace"]) ?? "") ?? ""
            if .stacktrace == "" { .stacktrace = rest }
          } else {
            # slog text: time=2026-05-14T10:00:00Z level=INFO msg="..."
            parsed_kv, err2 = parse_key_value(first, field_delimiter: " ", key_value_delimiter: "=")
            if err2 == null && is_object(parsed_kv) && exists(parsed_kv.msg) {
              .level = downcase(to_string(get(parsed_kv, ["level"]) ?? "") ?? "") ?? ""
              .message = to_string(parsed_kv.msg) ?? first
              ts_str = to_string(get(parsed_kv, ["time"]) ?? "") ?? ""
              .timestamp = if ts_str != "" { parse_timestamp!(ts_str, "%+") } else { now() }
            } else {
              # Standard library log: 2026/05/14 10:00:00 message
              parsed_std, err3 = parse_regex(first,
                r'^(?P<ts>\d{4}/\d{2}/\d{2} \d{2}:\d{2}:\d{2})\s+(?P<msg>.+)$')
              if err3 == null && parsed_std != null {
                .timestamp = parse_timestamp!(to_string(parsed_std.ts) ?? "", "%Y/%m/%d %H:%M:%S")
                .message = to_string(parsed_std.msg) ?? first
              } else {
                .message = first
                .timestamp = now()
              }
              .level = ""
            }
            .stacktrace = rest
          }
        }

        .namespace = .kubernetes.pod_namespace
        .pod = .kubernetes.pod_name
        .container = .kubernetes.container_name
        .node = .kubernetes.node_name

        del(.kubernetes); del(.stream); del(.file); del(.source_type)

    parse_k8s:
      type: remap
      inputs: [route_source.k8s_system]
      source: |
        .stream = string(.stream) ?? ""
        .namespace = .kubernetes.pod_namespace
        .pod = .kubernetes.pod_name
        .container = .kubernetes.container_name
        .node = .kubernetes.node_name
        del(.kubernetes); del(.file); del(.source_type)

    enrich_unmatched:
      type: remap
      inputs:
        - route_source._unmatched
        - parse_envoy_access.dropped
        - parse_nginx_access.dropped
      source: |
        .stream = string(.stream) ?? ""
        .namespace = .kubernetes.pod_namespace
        .pod = .kubernetes.pod_name
        .container = .kubernetes.container_name
        .node = .kubernetes.node_name
        .file = string(.file) ?? ""
        del(.kubernetes); del(.source_type)

  sinks:
    # ── ClickHouse sinks — one per table ───────────────────────────────────
    # All sinks use disk buffers — events survive ClickHouse restarts.

    clickhouse_envoy_access:
      type: clickhouse
      inputs: [parse_envoy_access]
      endpoint: "http://clickhouse.logging.svc.cluster.local:8123"
      database: logs
      table: envoy_access_logs
      auth:
        strategy: basic
        user: "${CLICKHOUSE_USER}"
        password: "${CLICKHOUSE_PASSWORD}"
      compression: gzip
      batch:
        max_bytes: 10485760
        timeout_secs: 10
      buffer:
        type: disk
        max_size: 1073741824
        when_full: block

    clickhouse_envoy_system:
      type: clickhouse
      inputs: [parse_envoy_system]
      endpoint: "http://clickhouse.logging.svc.cluster.local:8123"
      database: logs
      table: envoy_logs
      auth:
        strategy: basic
        user: "${CLICKHOUSE_USER}"
        password: "${CLICKHOUSE_PASSWORD}"
      compression: gzip
      batch:
        max_bytes: 10485760
        timeout_secs: 10
      buffer:
        type: disk
        max_size: 1073741824
        when_full: block

    clickhouse_nginx_access:
      type: clickhouse
      inputs: [parse_nginx_access]
      endpoint: "http://clickhouse.logging.svc.cluster.local:8123"
      database: logs
      table: nginx_access_logs
      auth:
        strategy: basic
        user: "${CLICKHOUSE_USER}"
        password: "${CLICKHOUSE_PASSWORD}"
      compression: gzip
      batch:
        max_bytes: 10485760
        timeout_secs: 10
      buffer:
        type: disk
        max_size: 1073741824
        when_full: block

    clickhouse_nginx_error:
      type: clickhouse
      inputs: [parse_nginx_error]
      endpoint: "http://clickhouse.logging.svc.cluster.local:8123"
      database: logs
      table: nginx_error_logs
      auth:
        strategy: basic
        user: "${CLICKHOUSE_USER}"
        password: "${CLICKHOUSE_PASSWORD}"
      compression: gzip
      batch:
        max_bytes: 10485760
        timeout_secs: 10
      buffer:
        type: disk
        max_size: 1073741824
        when_full: block

    clickhouse_java:
      type: clickhouse
      inputs: [parse_java]
      endpoint: "http://clickhouse.logging.svc.cluster.local:8123"
      database: logs
      table: java_logs
      auth:
        strategy: basic
        user: "${CLICKHOUSE_USER}"
        password: "${CLICKHOUSE_PASSWORD}"
      compression: gzip
      batch:
        max_bytes: 10485760
        timeout_secs: 10
      buffer:
        type: disk
        max_size: 1073741824
        when_full: block

    clickhouse_tomcat:
      type: clickhouse
      inputs: [parse_tomcat]
      endpoint: "http://clickhouse.logging.svc.cluster.local:8123"
      database: logs
      table: tomcat_logs
      auth:
        strategy: basic
        user: "${CLICKHOUSE_USER}"
        password: "${CLICKHOUSE_PASSWORD}"
      compression: gzip
      batch:
        max_bytes: 10485760
        timeout_secs: 10
      buffer:
        type: disk
        max_size: 1073741824
        when_full: block

    clickhouse_golang:
      type: clickhouse
      inputs: [parse_golang]
      endpoint: "http://clickhouse.logging.svc.cluster.local:8123"
      database: logs
      table: go_logs
      auth:
        strategy: basic
        user: "${CLICKHOUSE_USER}"
        password: "${CLICKHOUSE_PASSWORD}"
      compression: gzip
      batch:
        max_bytes: 10485760
        timeout_secs: 10
      buffer:
        type: disk
        max_size: 1073741824
        when_full: block

    clickhouse_k8s:
      type: clickhouse
      inputs: [parse_k8s]
      endpoint: "http://clickhouse.logging.svc.cluster.local:8123"
      database: logs
      table: k8s_logs
      auth:
        strategy: basic
        user: "${CLICKHOUSE_USER}"
        password: "${CLICKHOUSE_PASSWORD}"
      compression: gzip
      batch:
        max_bytes: 10485760
        timeout_secs: 10
      buffer:
        type: disk
        max_size: 1073741824
        when_full: block

    clickhouse_unmatched:
      type: clickhouse
      inputs: [enrich_unmatched]
      endpoint: "http://clickhouse.logging.svc.cluster.local:8123"
      database: logs
      table: unmatched_logs
      auth:
        strategy: basic
        user: "${CLICKHOUSE_USER}"
        password: "${CLICKHOUSE_PASSWORD}"
      compression: gzip
      batch:
        max_bytes: 10485760
        timeout_secs: 10
      buffer:
        type: disk
        max_size: 1073741824
        when_full: block
Part 1: Comparison, storage model, compression, resource consumption, ingest, and SaaS options
Part 3: Security & Compliance — encryption, RBAC, WORM / S3 Object Lock