Elasticsearch vs. OpenSearch vs. Loki vs. Quickwit vs. ClickHouse: UX, Dashboards & Alerts
Table of contents
Day-to-day operability of a log archive depends less on storage internals and more on what happens when an engineer opens a browser and searches for the cause of last Tuesday’s outage — or, years later, a compliance auditor queries a 4-year-old event trail. The five systems differ substantially in the quality of their search UI, how well they support dashboard building and sharing, and how (or whether) they handle alerts natively. This post covers all of those dimensions.
This is Part 4 of a five-part series.
- Part 1 — Comparison: Storage tiering, compression, resource consumption, query languages, SaaS options
- Part 2 — Operations: Setup, ingest pipeline, ECS vs. OTel, backup & DR, observability, alerting
- Part 3 — Security & Compliance: Encryption, RBAC, WORM / S3 Object Lock
- Part 4 — UX, Dashboards & Alerts — this post: UI layers, log search UX, cold-tier query behaviour, dashboards, sharing, alerting
- Part 5 — Use Case: Vector, Istio/Envoy, nginx, Java on OVH MKS — complete ClickHouse ingestion setup and monthly awffull report
TL;DR🔗
| Elasticsearch | OpenSearch | Loki | Quickwit | ClickHouse | |
|---|---|---|---|---|---|
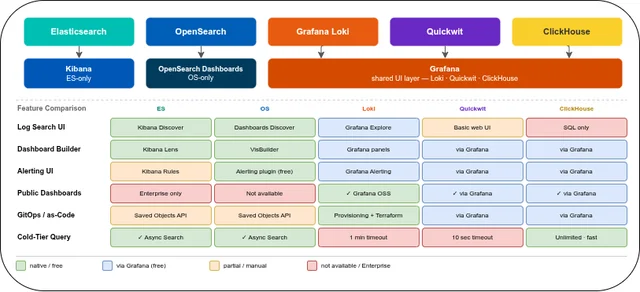
| Built-in UI | Kibana | OpenSearch Dashboards | Grafana (community) | Minimal web UI | None (Grafana / Superset) |
| Log search UX | Kibana Discover (best-in-class) | Dashboards Discover | Grafana Explore (LogQL) | Basic search UI | SQL via Grafana / CH Play |
| Dashboard builder | Kibana Lens / Canvas | VisBuilder | Grafana panel editor | ✓ (via Grafana) | ✓ (via Grafana) |
| Mixed datasources in one dashboard | ✗ (ES only) | ✗ (OS only) | ✓ (any Grafana datasource) | ✓ (via Grafana) | ✓ (via Grafana) |
| Shared / public dashboards | Spaces + URL (public: Enterprise) | Tenant spaces + URL | Public snapshots + Public dashboards (OSS) | Via Grafana | Via Grafana |
| Native alerting UI | Kibana Rules | OpenSearch Alerting plugin (free) | Grafana Alerting (free) | ✗ (external) | ✗ (external) |
| Alert notification routing | Connectors (some: Enterprise) | All destinations free | Alertmanager-compatible | Via Grafana | Via Grafana |
| Multi-team UI isolation | Kibana Spaces (free) | Dashboard Tenants (free) | Grafana Teams + Folders | Via Grafana | Via Grafana |
| Dashboard-as-Code / GitOps | Saved Objects API | Saved Objects API | JSON provisioning + Terraform | Via Grafana | Via Grafana |
Built-in UI vs. External UI Layer🔗
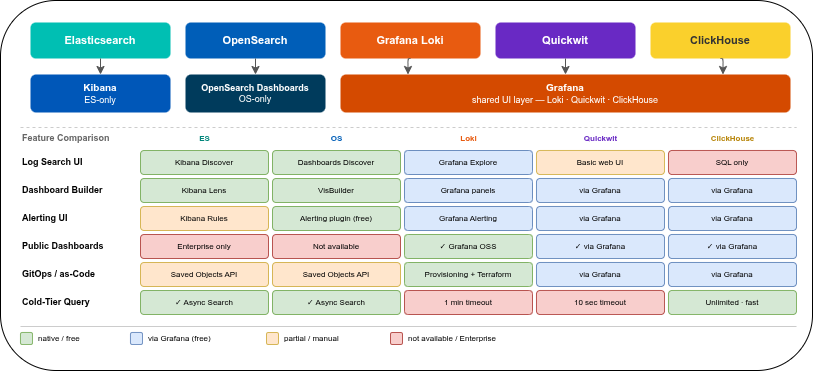
Elasticsearch ships Kibana as its dedicated UI — tightly coupled, ES-only, and deep-featured. OpenSearch ships OpenSearch Dashboards, a free fork of Kibana with the same depth. Both are purpose-built for their respective search engines and cannot connect to any other datasource.
Loki, Quickwit, and ClickHouse have no equivalent built-in dashboard layer. All three rely on Grafana (or alternatives like Apache Superset or Metabase). This is a genuine trade-off: Grafana is a universal datasource layer — a single Grafana instance can show Loki logs, Prometheus metrics, and ClickHouse query results in the same dashboard row, something Kibana can structurally never do. The cost is that Grafana’s log investigation UX is less purpose-built than Kibana Discover.
Elasticsearch / Kibana🔗
Kibana is the most feature-complete purpose-built log UI of the five. Discover handles ad-hoc investigation; Lens handles dashboard building; Canvas handles pixel-precise reports. All tightly integrated with Elasticsearch’s query engine, including ESQL (the new pipe-based query language), KQL, and Lucene syntax.
OpenSearch / OpenSearch Dashboards🔗
Forked from Kibana at the 7.10 branch (early 2021), OpenSearch Dashboards has maintained rough feature parity for day-to-day use. The Discover interface, dashboard builder, and multi-tenancy are functionally equivalent. The main divergence: OpenSearch Dashboards lacks Kibana Lens’s polished drag-and-drop visualisation builder (it uses the older Visualize builder and the newer VisBuilder, which is less mature than Lens) and has no equivalent to Kibana’s ML-powered Pattern Detection in Discover.
Loki / Grafana🔗
Grafana supports Loki as a first-class datasource with a dedicated Logs panel and LogQL query builder in Explore. The main gap relative to Kibana Discover: Loki’s data model is label-centric, not field-centric, so there is no automatic field extraction sidebar. Field parsing happens in the query (| json, | logfmt, | pattern) rather than at index time. For teams already running Grafana for metrics, adding Loki requires no new UI tooling.
Quickwit / Grafana🔗
Quickwit has a minimal built-in web UI for index management and basic search queries. For dashboards and alerting, the Grafana datasource plugin is the intended path. The built-in UI is useful for verifying ingest and running one-off queries but is not a substitute for Grafana in a production setup.
ClickHouse / Grafana🔗
ClickHouse has no dashboard UI. For ad-hoc SQL queries, ClickHouse Play (a web-based SQL editor, also self-hostable) is useful. For production dashboards and alerting, Grafana (official datasource plugin) is the standard choice. Apache Superset and Metabase also support ClickHouse and provide richer BI-style visualisations if the use case extends beyond log search.
Log Search & Investigation UX🔗
Kibana Discover🔗
Kibana Discover is the strongest purpose-built log investigation UI of the five:
- Field extraction sidebar: all fields parsed from JSON logs are listed with a value frequency histogram — click a field to add it as a column or filter
- Surrounding documents context: open a log entry and view the N documents before and after it by timestamp, without constructing a separate query
- Pattern detection: ML-based clustering groups log messages by pattern and counts occurrences — useful for finding anomalies in noisy streams without writing aggregations
- Saved searches: persist a query + column configuration for repeated use
- ESQL support: new pipe-based query language with type-aware transformations
OpenSearch Dashboards Discover🔗
Functionally similar to Kibana Discover. Differences worth noting:
- PPL (Piped Processing Language): an alternative query syntax in addition to DQL; SQL is also available via the Query Workbench plugin
- No ML-based pattern detection equivalent to Kibana’s
- The UI feels slightly less polished than modern Kibana on dense log streams, but covers all standard investigation workflows
Grafana Explore (Loki)🔗
Grafana Explore is the entry point for ad-hoc Loki queries:
- LogQL query builder: a visual builder for label filters, line filters, and parser stages; falls through to manual LogQL editing for complex queries
- Split panels: view two queries side by side (e.g., errors vs. warnings, two time windows)
- Live tail: stream new log entries in real time without polling
- Log details panel: expand a log entry to see all parsed fields and label values
The key limitation: there is no field extraction sidebar populated from historical data. To filter on a parsed field (e.g., level=error from a JSON log), you must add the appropriate parser stage (| json) and filter explicitly. For teams accustomed to Kibana Discover’s auto-populated sidebar, this requires a shift in workflow.
Quickwit UI🔗
The built-in Quickwit web UI offers a search bar, time range picker, and results table. There is no field-level drill-down, no context view for surrounding log entries, and no saved searches. For routine ad-hoc investigation, the Grafana datasource plugin is more capable than the built-in UI.
ClickHouse (Grafana or ClickHouse Play)🔗
ClickHouse has no dedicated log investigation UI. In practice this means writing SQL directly in Grafana Explore or ClickHouse Play. This is the most flexible model — any aggregation, any join, any time-series transform — but requires SQL knowledge. There is no pre-built log-centric view. For teams comfortable with SQL, the query expressiveness compensates for the lack of a log-specific UI.
Querying Historical Data — Cold-Tier Behaviour🔗
For a 7-year log archive, querying data from 4 years ago is not an edge case — it is a normal investigative or compliance workflow. The five systems behave very differently when a query must fetch data from cold object storage: some time out silently, some run asynchronously in the background, some are fast due to columnar pruning.
| Elasticsearch | OpenSearch | Loki | Quickwit | ClickHouse | |
|---|---|---|---|---|---|
| Default UI time range | Last 15 min | Last 15 min | Last 1 hour | Last day | — (SQL: explicit WHERE) |
| Cold-tier query mechanism | Async search (progress bar) | Async search | Sync (blocking) | Sync (blocking) | Sync (blocking) |
| Default query timeout | No hard limit (configurable) | No hard limit | 1 min (query frontend) | 10 seconds | Unlimited (max_execution_time=0) |
| Background query (browser close) | ✓ async search API | ✓ async search API | ✗ | ✗ | ✗ |
| Resumable query sessions | ✓ Enterprise (Search Sessions) | ✗ | ✗ | ✗ | ✗ |
| Automatic time-range splitting | ✗ | ✗ | ✓ split_queries_by_interval | ✗ | ✗ |
| S3 data cache after first query | ✓ shard cache (local SSD) | ✓ shard cache | ✓ chunk cache | ✓ split cache (opt-in) | ✓ mark files cached |
| Performance for column-filtered queries | Medium (row-oriented segments) | Medium | Slow (full chunk decompression) | Fast (inverted index + docstore) | Very fast (columnar prune + skip index) |
Elasticsearch (Kibana + Frozen Tier)🔗
Kibana uses the async search API for slow queries: as soon as the query is submitted, a progress indicator appears in Discover. The query runs server-side and continues even if the browser tab is closed — results are stored for 5 days by default. Kibana shows a “slow search” badge for queries taking more than 30 seconds.
Frozen tier queries fetch searchable snapshot shards from S3 on first access, then cache them on local SSD. The second query against the same shard is significantly faster. For a 4-year-wide time range, expect the first cold query to take minutes; subsequent queries to the same time window are faster.
Kibana Search Sessions (Enterprise): save a long-running search as a named session, bookmark the URL, close the browser. Return hours later and resume from the stored results. This is the only feature of its kind across the five systems.
There is no hard default query timeout for frozen tier searches — queries run until complete or until the client disconnects.
OpenSearch Dashboards + Frozen Tier🔗
Async search is available (mirroring Elasticsearch’s implementation). The key difference: OpenSearch OSS has no equivalent to Kibana Search Sessions — if the browser is closed before the async query completes, the result is stored server-side but there is no UI mechanism to return to it. Frozen tier caching behaviour is the same as Elasticsearch.
Loki (Grafana Explore)🔗
Loki’s query frontend has a query_timeout setting with a default of 1 minute. For a query spanning 4 years of cold S3 data, this default is nearly always insufficient.
split_queries_by_interval (default: 1 day) partially mitigates this: Loki splits the requested time range into 1-day chunks and queries them in parallel. This reduces the time for many historical queries, but cannot overcome the fundamental latency of fetching and decompressing thousands of chunks from S3.
There is no async mechanism: if a query times out, Grafana returns a context deadline exceeded error and nothing is stored. The user must retry with a narrower time window. For archive investigations against cold Loki data, the practical recommendation is to pin a narrow date range (1–7 days) explicitly in Grafana Explore rather than querying the full archive span.
Settings to raise for archival query workflows:
# loki/values.yaml (Helm)
querier:
  query_timeout: 30m
frontend:
  querier_forget_delay: 5m
The Grafana datasource timeout (default 30 seconds) must also be raised independently in the datasource configuration.
Quickwit🔗
Quickwit’s search.request_timeout_secs defaults to 10 seconds — effectively unusable for any query touching cold S3 data with more than a few matching splits. There is no async search API as of version 0.9.x; queries are entirely synchronous.
For historical queries, the split_cache (opt-in, local disk) helps on repeated access to the same time window: the first cold query is slow, subsequent queries within the cache TTL are much faster. The practical approach for archive investigations: raise the timeout to minutes, use a narrow date range per query, and rely on the split cache for repeated runs.
ClickHouse🔗
ClickHouse’s max_execution_time defaults to 0 (unlimited) — queries run until complete or until the client disconnects. For a typical archival query with a selective WHERE clause (timestamp range + service + log level), ClickHouse is the fastest of the five systems even against cold S3 data: columnar storage with part skipping means only relevant parts and columns are read, regardless of how old the data is.
A query for level = 'ERROR' AND service = 'payments' over a 4-year S3 cold tier reads only the .bin column files for those three fields and skips all parts whose min/max range does not overlap the timestamp filter. Compare this to Loki, which must decompress entire log chunks to parse a field from the raw message.
ClickHouse queries remain synchronous — there is no progress UI in Grafana or ClickHouse Play. For very wide queries, setting an appropriate Grafana datasource timeout (minutes, not seconds) prevents premature client-side disconnects.
Dashboards — Builder, Template Variables, Drill-down🔗
Kibana Lens🔗
Kibana Lens is a drag-and-drop dashboard builder with 20+ chart types: time series, pie, heatmap, data table, tag cloud, treemap. Template variables are implemented via Controls (dropdown, range slider, options list). Time brushing allows selecting a region in a time series chart to drill into that time window automatically. Dashboards are ES-only — no external datasources can be mixed in.
OpenSearch VisBuilder🔗
OpenSearch provides the older Visualize builder and VisBuilder (the newer replacement, still less polished than Kibana Lens as of early 2026). SQL and PPL queries are available in Visualize. Mixed datasources are not supported — dashboards are OS-only.
Grafana Panel Editor🔗
Grafana’s panel editor supports 30+ panel types, including a purpose-built Logs panel that renders log streams with collapsible detail rows, label filters, and wrap controls. Key capabilities absent from Kibana:
- Template variables: query-driven dropdowns (e.g., a list of all services from Loki labels or a ClickHouse
SELECT DISTINCT service FROM logs), multi-value, ad-hoc filters - Mixed datasource panels: show Prometheus error rate alongside matching Loki log lines in the same dashboard row — useful for correlating metrics and logs without switching tools
- Data links: click a log entry to open a linked dashboard pre-filtered to that service and time window
- Grafana Scenes (v10+): dynamic dashboard layouts with more complex state management
Shared Dashboards & Collaboration🔗
Kibana Spaces🔗
Kibana Spaces (free since 7.0) provide separate namespaces per team for saved objects: dashboards, visualisations, saved searches, and index patterns are all scoped to a Space. Users and roles are assignable per Space; the URL prefix is /s/teamname/. Data isolation is handled separately via RBAC (Spaces are UI-object isolation, not data isolation).
Public, unauthenticated dashboard sharing requires Enterprise. Embedding dashboards in external pages via iframe also requires Enterprise.
OpenSearch Dashboards Tenants🔗
OpenSearch Dashboards Tenants (free) cover the same concept as Kibana Spaces with three modes: global (visible to all), shared (visible to users who opt in), and private (per-user only). All modes are part of the Apache 2.0 Security plugin — no paid tier required. Public unauthenticated sharing has the same limitation as Kibana.
Grafana (Loki / Quickwit / ClickHouse)🔗
Grafana has the strongest sharing model of the five:
- Public dashboards (GA since Grafana 10): a permanent public URL for a dashboard — any internet user can view live data without logging in. Useful for status pages or executive summaries.
- Dashboard snapshots: a static copy of the current dashboard state, shareable as a link. Can be hosted locally or on snapshot.raintank.io. No live data, no auth required.
- Playlist: auto-rotate multiple dashboards on a timer — the standard NOC screen pattern.
- Teams + folder permissions (OSS): assign view/edit/admin per folder per team. Datasource access is all-or-nothing in OSS — a team can use a datasource or not, with no query-level restriction (that requires Enterprise).
- Grafana Enterprise: per-dashboard and per-datasource permissions per team; LDAP / Active Directory team sync for automated permission management.
Alert Management UI🔗
Kibana Alerting🔗
Kibana Rules UI covers: ES-query-based rules, index threshold rules, and ML anomaly rules. Connectors (notification targets) include Slack, PagerDuty, email, webhook, Jira, and ServiceNow — some connectors require Platinum or Enterprise. The alert state machine (Active → Recovered → Error) is tracked in the UI with a history timeline. Snooze schedules allow muting a rule for a defined period. Flapping detection suppresses alerts that repeatedly fire and recover within a short window.
OpenSearch Alerting Plugin (free)🔗
OpenSearch Alerting ships as a free plugin (Apache 2.0). Monitors are defined as ES DSL, PPL, or SQL queries with threshold triggers. Multiple triggers per monitor are supported. Destinations — the equivalent of Kibana connectors — include Slack, PagerDuty, email, webhook, Amazon SNS, and Amazon Chime, all free. Per-alert acknowledgement is available in the UI. Flapping detection is not present.
Grafana Alerting (Loki / Quickwit / ClickHouse)🔗
Grafana Alerting (unified alerting since Grafana 9) is the alert management layer for any system using Grafana as its UI. Key advantages:
- Alertmanager-compatible routing: alert rules route to contact points via Alertmanager routing trees — grouping, inhibition, and silence rules work identically to a standalone Alertmanager. Teams already running Prometheus + Alertmanager get full integration at no extra cost.
- Contact points: Slack, PagerDuty, email, webhook, OpsGenie, Telegram, Discord, Microsoft Teams, and more — all free in OSS.
- Silences: regexp-based, time-bounded — well-suited for maintenance windows where alerts should not fire without disabling the rule.
- Grafana OnCall (OSS, optional): on-call scheduling, escalation chains, and a mobile app. Can be self-hosted; the OSS edition is free. Integrates with Grafana Alerting as a contact point.
For ClickHouse and Quickwit, Grafana Alerting is the only production-grade alert management UI available without building a custom solution.
Multi-Team UI Isolation🔗
Kibana Spaces (free)🔗
One Space per team is the standard pattern: each team sees only their own saved dashboards, visualisations, and searches under their Space URL. Data isolation between teams is a separate concern handled by index-level RBAC — Spaces govern UI objects, not which Elasticsearch indices a role can read. Roles are assignable per Space.
OpenSearch Dashboards Tenants (free)🔗
Functionally equivalent to Kibana Spaces. Three tenant modes (global, shared, private) allow flexible sharing of dashboards within a tenant boundary. The full multi-tenancy feature is part of the free Security plugin — not gated by a paid tier.
Grafana Teams + Folders🔗
The recommended OSS pattern: create a team per engineering group, create a Grafana folder per team, assign view/edit/admin permissions on that folder to the corresponding team. Dashboards inside the folder are visible only to the assigned team. At the datasource level, OSS Grafana is all-or-nothing — a team member who can see a datasource can query it without restriction (datasource-level query permissions require Grafana Enterprise).
Dashboard-as-Code / GitOps🔗
Kibana🔗
Kibana Saved Objects API exports dashboards as .ndjson bundles. The workflow is manual: export → commit to Git → import on target. The community elastic/kibana Terraform provider can manage dashboards, Spaces, and alert rules declaratively, but the ecosystem is less mature than Grafana’s.
OpenSearch🔗
Similar Saved Objects export mechanism. The community opensearch-project Terraform provider covers basic objects. Less GitOps tooling available compared to Grafana.
Grafana (Loki / Quickwit / ClickHouse)🔗
Grafana has the most mature GitOps story of the five:
- Provisioning: mount YAML config files and dashboard JSON files into the Grafana container or pod via a Kubernetes ConfigMap. Dashboards appear on startup, versioned in Git — the standard Kubernetes-native pattern for managing Grafana at scale.
- Official Grafana Terraform provider: manages dashboards, folders, teams, data sources, alert rules, and notification policies declaratively. All resources are importable from an existing instance.
- Grizzly (
grafanacloud/grizzly): a CLI tool for Grafana-as-code diff and apply workflows, similar tokubectl applyfor Grafana resources. - Dashboard JSON models are stable and diff-friendly in pull requests.
For teams running Loki, Quickwit, or ClickHouse, the Grafana GitOps tooling is a significant operational advantage over what Kibana and OpenSearch Dashboards offer.
FAQ🔗
Does Kibana require a paid license for basic log search?🔗
No. The free Basic tier covers Kibana Discover, dashboard building (Lens, Canvas), Kibana Spaces, and a subset of Kibana Alerting connectors. Enterprise gates the following: ML anomaly detection and pattern clustering in Discover, Search Sessions (resumable cold queries), PDF reporting, certain alert connectors (Jira, ServiceNow), and full query audit logging.
How do I query X-year-old logs from cold storage without hitting timeouts?🔗
The answer differs substantially per system.
Elasticsearch / OpenSearch: no special configuration needed in most cases. The async search API runs the query server-side and shows a progress indicator in Discover — the query continues even if the browser tab is closed, and results are stored for 5 days by default. There is no hard default timeout for frozen tier queries. Repeated queries to the same frozen shard are significantly faster after the first access (shard cache on local SSD). For Elasticsearch with an Enterprise licence, Kibana Search Sessions allow saving a long-running query as a named bookmark and resuming it later — the only feature of its kind across the five systems.
Loki: two independent timeouts must be raised:
# loki/values.yaml (Helm)
querier:
  query_timeout: 30m
frontend:
  querier_forget_delay: 5m
The Grafana datasource timeout (default 30 seconds) must also be raised in the datasource configuration. Beyond settings: always pin a narrow date range (1–7 days) in Grafana Explore — split_queries_by_interval parallelises the work per day but does not eliminate per-chunk S3 fetch latency. There is no async mechanism: if the query times out, Grafana returns context deadline exceeded with no partial result stored.
Quickwit: raise search.request_timeout_secs from its default of 10 seconds to minutes in quickwit.yaml:
search:
  request_timeout_secs: 300
Use narrow date ranges per query. Enable the split_cache for repeated access to the same time window — the first cold query is slow; subsequent queries within the cache TTL are significantly faster.
ClickHouse: no timeout issue — max_execution_time defaults to 0 (unlimited), so queries run until complete. Performance depends on query selectivity: always include an explicit WHERE on timestamp range plus indexed columns (service, log level) to engage columnar pruning and part skipping, limiting S3 reads to relevant parts only. Raise the Grafana datasource timeout (default 30 seconds) to several minutes so the client does not disconnect before ClickHouse returns results. There is no query progress UI.
Can I embed a Grafana dashboard in a public status page without requiring a login?🔗
Yes. Public Dashboards (GA since Grafana 10) generate a permanent shareable URL — any internet user can view live query results without authenticating. Teams running Loki, ClickHouse, or Quickwit behind Grafana get this capability for free in OSS. Kibana requires an Enterprise subscription for equivalent unauthenticated public embedding.
What is the difference between Kibana Spaces and OpenSearch Dashboard Tenants?🔗
Functionally equivalent: both provide separate namespaces for saved UI objects (dashboards, visualisations, saved searches) scoped per team or project. The operational difference is cost: Kibana Spaces are part of the free Basic tier; OpenSearch Dashboard Tenants are part of the Apache 2.0 Security plugin and equally free. Neither provides data isolation on its own — that requires RBAC configuration at the backend.
Can ClickHouse be used without Grafana for dashboards and alerts?🔗
For ad-hoc SQL investigation: ClickHouse Play (browser-based SQL editor) and tools like DBeaver or DataGrip work without Grafana. For production dashboards, time-series visualisation, and alerting, Grafana (or Apache Superset / Metabase for BI-style reports) is required. ClickHouse has no built-in dashboard or alerting UI.
Part 1: Comparison, storage model, compression, resource consumption, ingest, and SaaS options
Part 3: Security & Compliance — encryption, RBAC, WORM / S3 Object Lock