SigNoz on OVH MKS: The Complete Guide
Table of contents
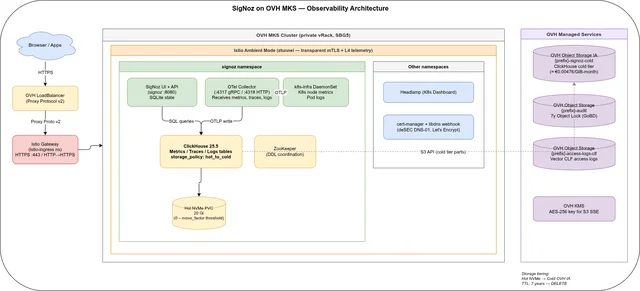
This is the index and reading guide for a three-part series that turns storage-engine theory into a fully reproducible, sovereign observability stack: SigNoz Community Edition on OVH Managed Kubernetes Service (MKS), with metrics, distributed traces, and logs all stored in a single ClickHouse cluster and cold-tiered to OVH Object Storage Infrequent Access. It is an alternative to hyperscaler-locked observability SaaS, built as a working example repository rather than a slide deck — clone it, fill in credentials, run Terraform and Ansible. Unlike a stack that bolts together Prometheus, Jaeger or Tempo, and Loki or Elasticsearch as three separately-operated databases, SigNoz stores metrics, traces, and logs together in ClickHouse from the start — one retention policy, one S3 tiering config, one SQL interface, instead of three.
Three things recur across all three parts and are worth naming up front. First, provisioning is Terraform + Ansible, not GitOps — Terraform owns OVH cloud infrastructure, Ansible owns Helm releases and post-install ClickHouse changes that are awkward to express as plain manifests. Second, Istio Ambient Mode provides the mesh: no sidecars, transparent mTLS via ztunnel, and Envoy waypoint proxies added per namespace only when L7 metrics are needed. Third, ClickHouse is the one storage engine underneath everything — metrics, traces, pod logs, and (in Part 3) structured Envoy access logs all land in the same hot-NVMe-to-S3-cold-tier policy, the same TTL mechanism, and the same SQL interface. The full example repository is at codeberg.org/nis-aleks/ovh-example-observability.
This series is fairly broad, but it is not, and cannot be, complete. Every deployment carries its own constraints — a compliance obligation on log retention, an existing ClickHouse or Terraform estate to integrate with, a team’s comfort with Ansible versus GitOps, a platform quirk on a different cloud — that can turn a general setup into the wrong starting point for that specific case. Treat this guide as a starting point, not a blueprint to apply unmodified: it is always worth discussing your own use case with people who know it before committing to any of the choices below.
How to read this guide🔗
The parts build on each other in the order they were written: infrastructure first, then telemetry, then a concrete use case built on top of the same ClickHouse cluster. If you already run the stack and want one part specifically, the summaries below say what each part decides for you.
- Part 1 — Infrastructure with Terraform + Ansible: OVH MKS, vRack, ClickHouse hot/cold storage policy, Istio Ambient bootstrap
- Part 2 — Metrics, Traces & Logs with Istio Ambient: OTLP ingestion, Istio metrics via ztunnel/waypoint, S3 cold-tier verification, 7-year cost estimate
- Part 3 — Access Log Reports with Vector and ClickHouse: structured Envoy access logs, monthly CLF export, awffull HTML reports over Istio
Part 1 — Infrastructure with Terraform + Ansible🔗
Audience: platform engineers provisioning the infrastructure.
Part 1 builds the whole platform from nothing: an OVH private network and gateway, a two-node MKS cluster, five Object Storage buckets, KMS, and then — via a single Ansible playbook with seven tagged roles — Istio Ambient Mode, cert-manager with DNS-01 challenges, Headlamp, and SigNoz itself. The distinguishing design decision is the ClickHouse storage policy configured post-install: a two-tier hot_to_cold policy that keeps recent parts on NVMe-backed Block Storage and migrates older parts to S3 Infrequent Access once the hot tier crosses a fill threshold, with per-data-type TTLs and a Gorilla+ZSTD codec for metric values. The part also explains a deliberate architecture choice: why this repo uses Terraform and Ansible executed locally instead of a GitOps controller, trading always-on control-plane components for a bootstrap that a small team can run, understand, and re-run end to end without a cluster already existing to host the deployment tooling itself.
Key takeaways:
- The stack needs a minimum of two
b3-8nodes — a single node saturates at ≈95% CPU requests and the autoscaler immediately adds a second, so start withnodepool_min_nodes = 2. - ClickHouse hot tier runs on
csi-cinder-high-speedPVCs (≈€0.09/GiB-month); cold tier is OVH Object Storage IA at ≈€0.00476/GiB-month with no egress or retrieval fees. - Retention is set per data type: traces 90 days total (7 hot), metrics 2 years (7 hot), logs 7 years (7 hot) — matching the retention requirement from the earlier log-archiving series.
- ZSTD(3) block compression plus a Gorilla codec on metric float columns cuts S3 cold-tier storage by roughly 30–50% versus ClickHouse’s default LZ4.
- OVH’s default quota for the demo region is tight: disk sits at 29/30 GB and both the Gateway and Load Balancer are maxed at 1/1 — request quota increases before adding a second environment.
Read Part 1 — Infrastructure with Terraform + Ansible →
Part 2 — Metrics, Traces & Logs with Istio Ambient🔗
Audience: observability engineers wiring up telemetry after the cluster is running.
Part 2 picks up once the cluster from Part 1 is live and walks through actually using it: the first SigNoz login and admin account creation, scraping Istio Ambient’s ztunnel (L4) and waypoint (L7) Prometheus metrics into the SigNoz OTel Collector, sending OTLP traces from instrumented applications or automatically from Istio’s Zipkin-format spans, and collecting pod logs via the k8s-infra DaemonSet with no extra configuration. It closes by verifying the S3 cold tier is actually moving data with direct ClickHouse system.parts queries and lays out a 7-year cost estimate for the whole stack. The part also draws a clear line around what Community Edition does not do — no SSO, no built-in multi-tenancy, no ClickHouse replication — and names the concrete workaround for each rather than treating them as unaddressed gaps.
Key takeaways:
- Istio emits traces in Zipkin B3 format on port 9411, not OTLP — the SigNoz OTel Collector accepts Zipkin natively and converts internally, no extra collector config needed.
- L4 mesh metrics (bytes, connections) come from ztunnel for free; HTTP-level RED metrics (request rate, errors, latency) require deploying a waypoint proxy per namespace.
system.partsgrouped bydisk_nameis the direct way to confirm cold-tier moves are happening —s3_coldshould show a non-zerosize_on_diskonce the hot tier fills.- The 7-year estimate for the full stack — MKS control plane, 3×
c3-16nodes, IA storage, block storage, gateway — comes to ≈€32,400 (≈€385/month average), reusing the same ClickHouse backend so SigNoz adds no separate storage cost, only ≈€2.61/month for its own PVCs. - Community Edition has no SSO/SAML/OIDC and no ClickHouse clustering out of the box; both are workable for a single-team deployment via an authenticating reverse proxy, but are the first things to revisit before wider rollout.
Read Part 2 — Metrics, Traces & Logs with Istio Ambient →
Part 3 — Access Log Reports with Vector and ClickHouse🔗
Audience: ops/SRE building reporting on top of already-collected logs.
Part 3 is a concrete use case built entirely on infrastructure the first two parts already provisioned: a Vector DaemonSet parses Envoy’s JSON access logs from the Istio ingress gateway into a dedicated ClickHouse table, and a monthly CronJob exports that table as a Combined Log Format archive, generates HTML traffic reports with awffull, and serves them from an S3 static website proxied transparently through the existing Istio gateway. It is as much a lesson in ClickHouse/Vector integration edge cases as it is a reporting pipeline: timestamp formatting, IPv6 client-IP extraction, and OVH’s S3 API gaps all get worked around explicitly rather than glossed over. The part doubles as evidence for the through-line of the whole series: nothing about generating monthly traffic reports required a new database, a new ingestion agent role, or a change to the storage policy Part 1 already set up — only a new table and two new ClickHouse users on the existing cluster.
Key takeaways:
- Enabling Envoy access logs needs two Istio flags together —
accessLogEncoding=JSONalone does nothing withoutaccessLogFile=/dev/stdoutalso set. - ClickHouse’s
JSONEachRowparser rejects Vector’s default ISO 8601 timestamps; the fix is formatting timestamps in VRL as%Y-%m-%d %H:%M:%S%.3frather than adding abest_effortquery parameter, which breaks Vector’s healthcheck URL. - Routing all Envoy pods’ logs through one ClickHouse table (
ORDER BY (toDate(timestamp), status, client_ip)) avoids per-pod S3 key collisions and lets the monthly export scan a single partition even when that partition is already on cold storage. - OVH’s S3 implementation supports neither
PutBucketPolicynorPutBucketAclvia API — making the reports bucket public for static website hosting has to be done manually in the OVH Console. - Access reports contain visitor IPs, referrers, and user agents; the
reports.<domain>route is protected by the same IstioAuthorizationPolicy(trusted IPs or bearer token) as the SigNoz UI itself, not left open just because it serves static files.
Read Part 3 — Access Log Reports with Vector and ClickHouse →
The through-line🔗
Sovereignty and cost control versus hyperscaler lock-in. The whole series is framed as an EU-hosted alternative that avoids per-GB-ingested SaaS pricing. Part 2’s 7-year estimate (≈€32,400 total) is set explicitly against AWS CloudWatch (≈$196K), GCP Cloud Logging (≈$133K), and Azure Monitor Logs (≈$701K) at the same scale — the point is not that self-hosting is free, but that the cost structure and the data residency are both under the operator’s control.
ClickHouse as the one storage layer. Metrics, traces, Kubernetes pod logs, and structured Envoy access logs all end up in the same ClickHouse cluster, behind the same hot_to_cold storage policy and the same TTL mechanism. Part 3’s access-log pipeline does not introduce a second database — it adds one more table and two more ClickHouse users to infrastructure Part 1 already built.
A working demo, not a production blueprint. Every part repeats a version of the same warning: this is a reproducible example sized for a two-node staging cluster, not a hardened deployment. Single-replica ClickHouse, ConfigMap-stored S3 credentials, and an unauthenticated Headlamp instance are all named explicitly as gaps to close — External Secrets Operator, the Altinity ClickHouse operator, and OIDC via a reverse proxy or SigNoz Enterprise are the pointed-to production paths, not implemented in the repo itself. The cost figures throughout the series follow the same logic: each part states the OVH resources and prices at time of writing rather than a single blended number, so a reader on a different node size, region, or growth curve can substitute their own inputs into the same calculation instead of trusting a total that assumes their workload matches the demo’s.
Related deep-dives🔗
- Elasticsearch vs. OpenSearch vs. Loki vs. Quickwit vs. ClickHouse: The Complete Guide — the storage-engine comparison behind the ClickHouse choice here.
- LLM Inference on OVH MKS: The Complete Guide — another workload running on the same OVH MKS platform.
Where to start🔗
If you have no strong prior, read the parts in order — each one assumes the infrastructure and ClickHouse schema the previous part already set up. If you already run a ClickHouse-backed observability stack and only need the reporting pattern, Part 3 stands reasonably well on its own as long as you have JSON Envoy access logs to work with.