
SigNoz on OVH MKS: Metrics, Traces & Logs with Istio Ambient
Table of contents
Part 1 set up the infrastructure: OVH MKS, vRack, Istio Ambient Mode, and SigNoz itself via Terraform + Ansible. This post covers what to do after the cluster is running — sending telemetry data, verifying the S3 cold tier is active, and building the first dashboards.
Series navigation:
- Full guide: SigNoz on OVH MKS: The Complete Guide
- Part 1 — Infrastructure (Terraform + Ansible)
- Part 2 — Metrics, Traces & Logs (this post)
- Part 3 — Monthly Access Log Reports (Vector + awffull)
This post is based on a working demo, not a hardened production blueprint. OVH pricing changes over time — always verify current rates in the OVH Public Cloud pricing page before provisioning. The cost estimates in this post reflect prices at time of writing (May 2026). You are responsible for any costs incurred in your OVH account.
First login🔗
Open https://ops.<your-domain> and create the admin account. SigNoz shows a signup form exactly once — after the first account is created, the form disappears and you need the credentials to log in.
# If you missed the initial signup, reset via the SigNoz CLI:
kubectl exec -n signoz \
  $(kubectl get pods -n signoz -l app.kubernetes.io/name=signoz -o jsonpath='{.items[0].metadata.name}') \
  -- ./signoz user create --email admin@example.com --password changeme --name Admin
After login you land on the Services page — empty for now. Import the included dashboard first for a quick overview of cluster health:
- Go to Dashboards → New Dashboard → Import JSON
- Paste the contents of
dashboards/k8s-overview.jsonfrom the repo - Save
The dashboard shows node and pod CPU/memory usage, container restarts, and PVC usage — all sourced from the k8s-infra DaemonSet that’s already running.
After login you land on the Services page — empty for now. The k8s-infra DaemonSet installed by the Ansible role is already collecting Kubernetes infrastructure metrics and pod logs, but those appear under Infrastructure and Logs, not Services. Services are populated once your applications send OTLP traces.
Kubernetes infrastructure metrics (k8s-infra)🔗
The signoz/k8s-infra chart installs an OpenTelemetry Collector DaemonSet that scrapes:
- Node metrics: CPU, memory, disk, network from the kubelet
- Pod metrics: container resource usage
- Pod logs: all container stdout/stderr from every namespace
These flow into SigNoz via OTLP HTTP to signoz-otel-collector.signoz:4318. In the SigNoz UI, find them under:
- Infrastructure → Hosts: node-level CPU/memory
- Infrastructure → Kubernetes: pods, deployments, namespaces
- Logs → Logs Explorer: filter by
k8s.namespace.nameork8s.pod.name
No additional configuration needed — k8s-infra auto-discovers all pods via the Kubernetes API.
Istio Ambient metrics🔗
Istio Ambient Mode emits Prometheus-format metrics from ztunnel (L4) and Envoy waypoint proxies (L7). The SigNoz OTel Collector can scrape these directly.
Create a custom scrape config for the SigNoz OTel Collector by adding a values override to the Ansible role. Add the following to ansible/roles/signoz/templates/values.yaml.j2:
otelCollector:
  config:
    receivers:
      prometheus:
        config:
          scrape_configs:
            # Istio control plane metrics
            - job_name: istiod
              static_configs:
                - targets: ['istiod.istio-system:15014']

            # ztunnel per-node metrics (Ambient L4 proxy)
            - job_name: ztunnel
              kubernetes_sd_configs:
                - role: pod
                  namespaces:
                    names: [istio-system]
              relabel_configs:
                - source_labels: [__meta_kubernetes_pod_label_app]
                  action: keep
                  regex: ztunnel
                - source_labels: [__meta_kubernetes_pod_ip]
                  target_label: __address__
                  replacement: '$1:15020'

    service:
      pipelines:
        metrics:
          receivers: [otlp, prometheus]
          processors: [batch]
          exporters: [clickhouseMetrics]
After updating values.yaml.j2, re-run the signoz role:
ansible-playbook -i inventory/staging.yml site.yml --tags signoz --ask-vault-passIn the SigNoz UI, go to Metrics Explorer and search for istio_ — you should see ztunnel connection metrics and control plane health indicators within a few minutes.
L7 metrics via waypoint proxy🔗
ztunnel provides L4 metrics (bytes, connections). For HTTP request rates, error rates, and latency histograms (the RED metrics), you need a waypoint proxy. Enable one per namespace:
# Label namespace for Ambient (if not already done by istiod):
kubectl label namespace default istio.io/dataplane-mode=ambient

# Add L7 waypoint proxy for the default namespace:
kubectl apply -f - <<EOF
apiVersion: gateway.networking.k8s.io/v1
kind: Gateway
metadata:
  name: waypoint
  namespace: default
  labels:
    istio.io/waypoint-for: service
spec:
  gatewayClassName: istio-waypoint
  listeners:
    - name: mesh
      port: 15008
      protocol: HBONE
EOF
After the waypoint starts, HTTP metrics (istio_request_duration_milliseconds, istio_requests_total) appear in SigNoz Metrics Explorer for services in that namespace.
Distributed traces with OTLP🔗
SigNoz’s OTel Collector receives traces on:
signoz-otel-collector.signoz:4317— gRPC OTLPsignoz-otel-collector.signoz:4318— HTTP OTLP
Configure your application to send traces to either endpoint. For a Go application using the OTel SDK:
import "go.opentelemetry.io/otel/exporters/otlp/otlptrace/otlptracegrpc"

exporter, _ := otlptracegrpc.New(ctx,
    otlptracegrpc.WithEndpoint("signoz-otel-collector.signoz:4317"),
    otlptracegrpc.WithInsecure(),
)
For Java with the OTel Java agent, add these environment variables to the pod:
env:
  - name: OTEL_EXPORTER_OTLP_ENDPOINT
    value: "http://signoz-otel-collector.signoz:4317"
  - name: OTEL_SERVICE_NAME
    value: "my-java-service"
  - name: JAVA_TOOL_OPTIONS
    value: "-javaagent:/otel-javaagent.jar"
Automatic traces from Istio (without SDK instrumentation)🔗
Istio can emit spans for every HTTP request without any changes to your application code. Enable trace propagation in the Istio MeshConfig:
kubectl apply -f - <<EOF
apiVersion: v1
kind: ConfigMap
metadata:
  name: istio
  namespace: istio-system
data:
  mesh: |
    defaultConfig:
      tracing:
        sampling: 100.0
        zipkin:
          address: signoz-otel-collector.signoz:9411
EOFIstio sends traces in Zipkin B3 format (port 9411), not OTLP. The SigNoz OTel Collector accepts Zipkin at port 9411 by default and converts it to OTLP internally. No additional collector config needed.
After applying, every HTTP request that passes through Istio generates a span in SigNoz. Go to Traces → Trace Explorer and filter by service.name.
Pod Log Collection🔗
The k8s-infra DaemonSet collects all pod logs automatically. In the SigNoz Logs Explorer:
| Filter | Example |
|---|---|
| Namespace | k8s.namespace.name = signoz |
| Pod | k8s.pod.name = signoz-clickhouse-0 |
| Log level | severity_text = ERROR |
| Full-text search | message contains connection refused |
For structured logs (JSON), add the json_parser operator to the k8s-infra values. SigNoz will flatten the JSON keys as searchable attributes.
To send logs directly from an application via OTLP (instead of stdout collection):
from opentelemetry.exporter.otlp.proto.grpc._log_exporter import OTLPLogExporter
exporter =(
endpoint="http://signoz-otel-collector.signoz:4317",
insecure=True,
)Verifying the ClickHouse S3 cold tier🔗
After data has been ingested and the ClickHouse hot tier starts filling up (or you trigger a manual move), verify the cold tier is working:
# Connect to ClickHouse
kubectl exec -n signoz \
  $(kubectl get pods -n signoz -l app.kubernetes.io/name=clickhouse \
    -o jsonpath='{.items[0].metadata.name}') \
  -- clickhouse-client
-- List configured disks (should show default + s3_cold)
SELECT name, path, type, free_space, total_space
FROM system.disks;
-- Parts per disk and total size
SELECT
disk_name,
count() AS parts,
formatReadableSize(sum(bytes_on_disk)) AS size_on_disk
FROM system.parts
WHERE active
GROUP BY disk_name
ORDER BY disk_name;
-- Force a move for testing (moves the oldest partition to cold):
ALTER TABLE signoz_logs
MOVE PARTITION toYYYYMM(now - INTERVAL 1 MONTH) TO DISK 's3_cold';A successful cold-tier move shows s3_cold in the disk_name column with a non-zero size_on_disk. You can also check the OVH Object Storage console — parts appear as files under {prefix}-signoz-cold/.
To verify the configured TTL and column codecs:
-- Check TTL expressions per table
SELECT database, table, engine_full
FROM system.tables
WHERE database IN ('signoz_metrics', 'signoz_logs', 'signoz_traces')
AND engine_full LIKE '%TTL%';

-- Check per-column codecs (Gorilla on samples_v4.value, ZSTD elsewhere)
SELECT database, table, name, compression_codec
FROM system.columns
WHERE database IN ('signoz_metrics', 'signoz_logs', 'signoz_traces')
AND compression_codec != '';Alerting🔗
SigNoz Community Edition includes a built-in alert manager. Create alerts from the Alerts page — no Prometheus or separate Alertmanager required.
Example: alert when error rate exceeds 1% for any service:
- Go to Alerts → Create Alert → Metric-based
- Query:
rate(signoz_calls_total{status_code="STATUS_CODE_ERROR"}[5m]) / rate(signoz_calls_total[5m]) > 0.01 - Condition:
above 0.01 for 5 minutes - Notification channel: configure under Settings → Alert Channels (Slack, PagerDuty, webhook, email)
7-year cost estimate🔗
Using the same workload from the self-hosted series (100 GB/day raw logs, 7× compression ≈ 14.3 GB/day compressed):
| Component | Cost | Notes |
|---|---|---|
| OVH MKS control plane (SBG5) | ≈€6,567 (7y) | €78.18/month — for HA use a 3-AZ region (e.g. EU-WEST-PAR); SBG5 is single-AZ |
| 3× c3-16 nodes, 36-mo Savings Plan | ≈€17,978 (7y) | €71.34/node/month |
| OVH IA storage: 14.3 GB/day × 365 × 7 | ≈€7,400 (7y) | €0.00476/GiB-month |
| OVH Block Storage High Speed (29 GiB PVCs) | ≈€219 (7y) | €2.61/month; 20 GiB ClickHouse + 8 GiB ZooKeeper + 1 GiB SigNoz |
| OVH Gateway S (NAT for private nodes) | ≈€204 (7y) | €2.43/month incl. VAT |
| Floating IPs (nodes + LB) | included | 1× IPv4 + 1× IPv6 per node, 1× LB IPv4 — isAdditionalIp: false, billed as part of the node/LB price |
| Total | ≈€32,400 (7y) | ≈€385/month avg. |
This matches the ClickHouse self-hosted cost from the series — SigNoz adds no data storage overhead because it reuses the same ClickHouse backend, but it does add three persistent volumes (≈€2.61/month) and the S3 cold-tier credentials.
Minimum node count is 2. The full stack (ClickHouse, ZooKeeper, SigNoz, Istio, cert-manager, Headlamp, k8s-infra) saturates a single b3-8 at ≈95% CPU requests — the autoscaler immediately provisions a second node. The production estimate above already assumes c3-16 nodes; for staging on b3-8, budget 2× €0.113/h = ≈€163/month just for compute. Set nodepool_min_nodes = 2 from the start to avoid a rolling reschedule on first deploy.
Each additional node also adds a Floating IP pair (1× IPv4 + 1× IPv6, isAdditionalIp: false — included in the node price). The autoscaler can scale beyond desired_nodes up to max_nodes; set max_nodes conservatively until load is understood.
Compared to managed alternatives at the same scale: AWS CloudWatch ≈$196K, GCP Cloud Logging ≈$133K, Azure Monitor Logs ≈$701K. Full cost breakdown in the managed cloud series.
Community Edition limitations🔗
Before going to production, be aware of what’s missing:
- No SSO/SAML/OIDC: Every user needs a local account. Workaround: put Istio authorization policies or an authenticating reverse proxy in front of the SigNoz HTTPRoute.
- No multi-tenancy: All users see all data. For a single team this is fine; for isolation between teams, deploy separate SigNoz instances per namespace.
- No ClickHouse cluster: The bundled ClickHouse runs as a single replica. ClickHouse replication (via ZooKeeper/Keeper) is not enabled in the SigNoz chart by default. For HA, use the Altinity clickhouse-operator with a separate ClickHouse cluster and point SigNoz at it via
clickhouse.enabled: false+externalClickhouse.
All three are addressed by SigNoz Enterprise. For Community Edition on a single team cluster, the setup in this repo is production-ready as-is.
What’s next🔗
The repo at codeberg.org/nis-aleks/ovh-example-observability is a starting point. From here:
- Add your application: instrument with the OTel SDK and point it at
signoz-otel-collector.signoz:4317(in-cluster gRPC) orsignoz-otel-collector.signoz:4318(in-cluster HTTP) - Send telemetry from outside the cluster:
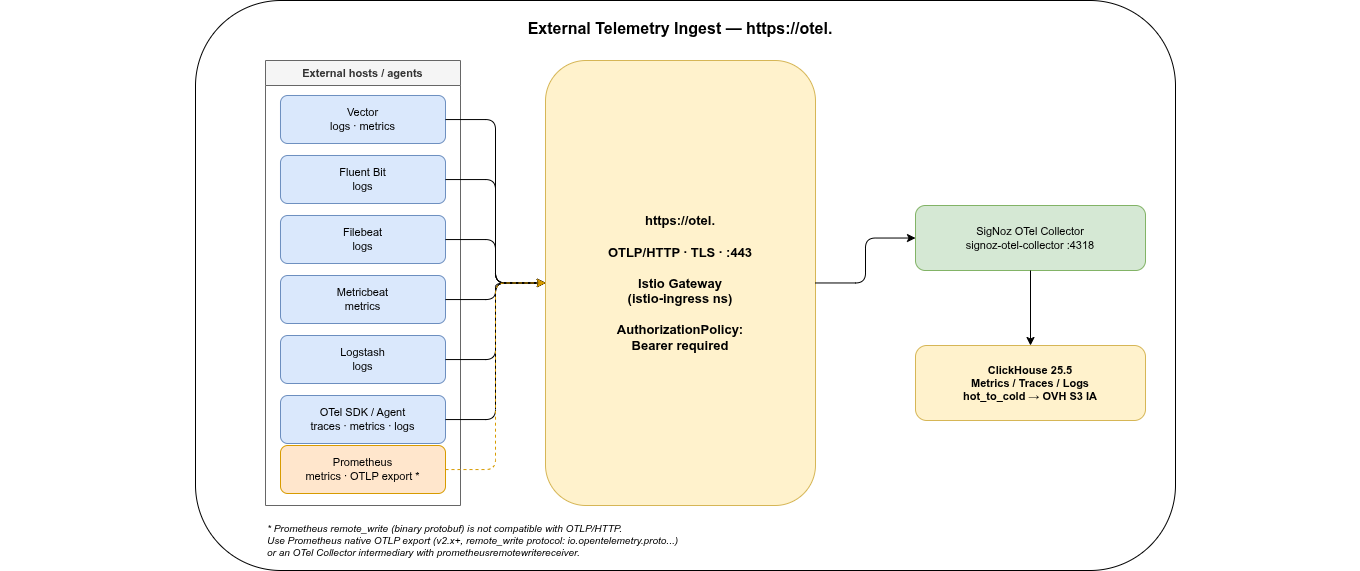
https://otel.<domain>is already live and accepts OTLP/HTTP from anywhere — no VPN or cluster access required. Useful for VMs, bare-metal hosts, or applications in other clusters. Configure an OpenTelemetry Collector on the external host with anotlphttpexporter pointing athttps://otel.<domain>and addAuthorization: Bearer <otel-token>as a header. The same endpoint accepts metrics, traces, and logs. - Add alerting channels: Slack webhook or PagerDuty under Settings → Alert Channels
- Add SSO: Community Edition has no built-in SSO — use an authenticating reverse proxy (e.g. oauth2-proxy) or upgrade to SigNoz Enterprise for native OIDC support
- Part 3: Monthly access log reports — Vector DaemonSet parses Envoy JSON logs into
logs.envoy_access_logsin ClickHouse; a monthly CronJob exports CLF archives to{prefix}-access-logs-clfand generates awffull HTML reports served viahttps://reports.<domain>through the existing Istio gateway - Adjust retention windows if needed: TTL is already configured by the Ansible role (traces 90d, metrics 730d, logs 2555d / 7 years). To change it, update
signoz_*_retention_daysinansible/roles/signoz/defaults/main.ymland re-run--tags signoz
Related posts:
- SigNoz on OVH MKS: Monthly Access Log Reports (Part 3) — Vector, ClickHouse, awffull reports via Istio ExternalName route
- Self-hosted Log Archiving: ClickHouse Use Case on OVH MKS — same ClickHouse + S3 setup, but for logs only via Vector
- Managed Log Archiving: AWS / GCP / Azure / OVH — cost comparison for managed alternatives