
LLM Inference on OVH MKS: Prometheus, Grafana, and KEDA
Part 1 covered the architecture and use cases. Part 2 walked through Terraform and Ansible. Part 3 covered models and the OpenAI API. This part adds observability (Prometheus + Grafana) and scale-to-zero autoscaling via KEDA.
Series navigation:
- Full guide: LLM Inference on OVH MKS: The Complete Guide
- Part 1 — Introduction
- Part 2 — Terraform, Ansible, and Deployment
- Part 3 — Models, AWQ, and OpenAI API
- Part 4 — Prometheus, Grafana, and KEDA (this post)
- Part 5 — Connect IDEs and Web UIs
- Part 6 — Self-hosted LLM Gateway
vLLM metrics🔗
vLLM exposes Prometheus metrics on port 8080 at /metrics. No extra configuration is needed — the port is included in the Deployment manifest from Part 1.
Key metrics:
| Metric | Type | What it measures |
|---|---|---|
vllm:num_requests_running | Gauge | Requests currently being processed |
vllm:num_requests_waiting | Gauge | Requests queued (KEDA trigger) |
vllm:num_requests_finished | Counter | Total completed requests |
vllm:time_to_first_token_seconds | Histogram | TTFT latency distribution |
vllm:generation_tokens_total | Counter | Tokens generated (use rate() for tokens/s) |
vllm:gpu_cache_usage_perc | Gauge | KV cache fill percentage (0–1) |
DCGM Exporter (from the GPU Operator) adds hardware-level GPU metrics:
| Metric | What it measures |
|---|---|
DCGM_FI_DEV_GPU_UTIL | GPU compute utilization % |
DCGM_FI_DEV_FB_USED | VRAM used (MiB) |
DCGM_FI_DEV_FB_FREE | VRAM free (MiB) |
DCGM_FI_DEV_MEM_COPY_UTIL | Memory bus utilization % |
The vllm: prefixed names used here reflect v0.21.0. Verify the exact names in your deployment with: kubectl exec -n vllm deploy/vllm -- curl -s http://localhost:8080/metrics | grep -E "^# HELP vllm"
Ansible role: prometheus🔗
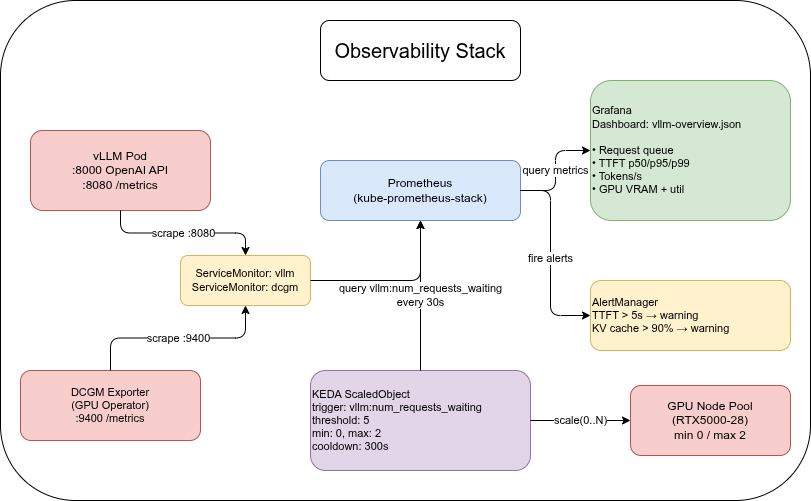
The prometheus role installs kube-prometheus-stack (Prometheus + Grafana + Alertmanager) and applies two ServiceMonitors — one for vLLM and one for the DCGM Exporter.
- name: Install kube-prometheus-stack
  ansible.builtin.command: >
    helm upgrade --install kube-prometheus-stack prometheus-community/kube-prometheus-stack
    --namespace {{ prometheus_namespace }}
    --version {{ prometheus_version }}
    --set grafana.enabled=true
    --set prometheus.prometheusSpec.serviceMonitorSelectorNilUsesHelmValues=false
    --set prometheus.prometheusSpec.podMonitorSelectorNilUsesHelmValues=false
    --wait --timeout 10m
The serviceMonitorSelectorNilUsesHelmValues=false flag is critical: without it, Prometheus only scrapes ServiceMonitors that carry the chart’s own Helm labels. Setting it to false makes Prometheus discover all ServiceMonitors in the cluster regardless of labels.
The vLLM ServiceMonitor:
apiVersion: monitoring.coreos.com/v1
kind: ServiceMonitor
metadata:
  name: vllm
  namespace: monitoring
  labels:
    release: kube-prometheus-stack
spec:
  namespaceSelector:
    matchNames:
      - vllm
  selector:
    matchLabels:
      app: vllm
  endpoints:
    - port: metrics
      path: /metrics
interval: 15sIf you already have SigNoz deployed from the SigNoz on OVH MKS series, you can skip the prometheus role. To scrape vLLM metrics, configure SigNoz’s OpenTelemetry Collector with a Prometheus receiver pointing at the vLLM pod endpoint (http://<pod-ip>:8080/metrics) — SigNoz does not automatically discover Prometheus Operator ServiceMonitors the way kube-prometheus-stack does. For the KEDA ScaledObject serverAddress, use SigNoz’s Prometheus-compatible query endpoint; check your SigNoz deployment with kubectl get svc -n signoz for the correct service name and port.
Grafana dashboard🔗
The companion repo includes dashboards/vllm-overview.json with the following panels:
- Request queue —
vllm:num_requests_running+vllm:num_requests_waitingover time - TTFT (p50 / p95 / p99) —
histogram_quantile()overvllm:time_to_first_token_seconds_bucket - Tokens per second —
rate(vllm:generation_tokens_total[1m]) - GPU KV cache usage —
vllm:gpu_cache_usage_perc * 100 - GPU utilization + VRAM — DCGM
DCGM_FI_DEV_GPU_UTILandDCGM_FI_DEV_FB_USED/FREE
To access Grafana without exposing it publicly:
kubectl port-forward -n monitoring svc/kube-prometheus-stack-grafana 3000:80
# Open http://localhost:3000 — default credentials: admin / prom-operator
To import the dashboard:
- Go to Dashboards → New → Import
- Paste the contents of
dashboards/vllm-overview.json - Select the Prometheus datasource
- Save
KEDA autoscaling🔗
KEDA (Kubernetes Event-Driven Autoscaling) watches a Prometheus metric and scales the vLLM Deployment based on the queue depth.
Important: the Prometheus trigger on vllm:num_requests_waiting handles scaling from 1 to N — not from 0 to 1. When vLLM is at 0 replicas, no pod is running to emit metrics. Prometheus returns no data, KEDA interprets that as 0 (below the threshold), and the Deployment stays at 0. The first request after scale-to-zero hits the Istio gateway with no backend pod available and receives a 503.
Two ways to handle scale-up-from-zero:
- KEDA HTTP Add-on — an additional KEDA component that intercepts incoming HTTP requests and triggers scale-up before forwarding; the first request is held until a pod is ready rather than dropped. Note: currently in beta, not yet marked production-ready.
minReplicaCount: 1— keep one warm pod running at all times; the Prometheus trigger still handles burst scaling (1→N), no requests are dropped; cost: continuous billing for one GPU node
Scale-down to zero works correctly with the configuration below: when the queue empties and cooldownPeriod expires, KEDA scales the Deployment to 0 and the Cluster Autoscaler releases the GPU node.
Ansible role: keda🔗
- name: Install KEDA
  ansible.builtin.command: >
    helm upgrade --install keda kedacore/keda
    --namespace {{ keda_namespace }}
    --version {{ keda_version }}
--waitScaledObject🔗
apiVersion: keda.sh/v1alpha1
kind: ScaledObject
metadata:
  name: vllm-scaler
  namespace: vllm
spec:
  scaleTargetRef:
    name: vllm
  minReplicaCount: 0          # scale-to-zero
  maxReplicaCount: 2
  cooldownPeriod: 300         # seconds before scaling down after queue empties
  pollingInterval: 30         # check Prometheus every 30 seconds
  triggers:
    - type: prometheus
      metadata:
        serverAddress: "http://prometheus-kube-prometheus-prometheus.monitoring.svc.cluster.local:9090"
        metricName: vllm_num_requests_waiting
        query: 'sum(vllm:num_requests_waiting{namespace="vllm"})'
threshold: "5" # scale up when > 5 requests are waitingIf using SigNoz, replace serverAddress with the address of SigNoz’s Prometheus-compatible query endpoint. The exact service name depends on your SigNoz deployment; find it with kubectl get svc -n signoz.
Scale-to-zero economics🔗
The GPU node is billed per hour on OVH (RTX5000-28 ≈€0.36/h as MKS node pool as of mid-2026 — verify current pricing before deploying). With minReplicaCount: 0:
- Scale-down to zero works: when the queue empties, KEDA scales to 0 after
cooldownPeriod, and the GPU node is released — no cost while idle - Scale-up from zero does not work with the Prometheus trigger alone (see the note above); use the KEDA HTTP Add-on or
minReplicaCount: 1 - With
minReplicaCount: 1: one warm GPU node always running, subsequent scale-up via Prometheus trigger; cold-start applies only when a second node is provisioned
Rough monthly cost reference (one RTX5000-28 node pool node):
| Usage pattern | Active hours/month | Estimated cost |
|---|---|---|
| 24/7 warm (minReplicaCount: 1) | 730 h | ≈€263 |
| Business hours only (8 h/day, 365 days) | 243 h | ≈€88 |
| Occasional use (2 h/day) | 60 h | ≈€22 |
| Scale-to-zero, mostly idle | depends on traffic | free when idle |
For a detailed cost breakdown including business-hours scheduling with Austrian public holidays, see Part 1 — Cost framing.
Whether the cold-start trade-off makes sense depends on your latency requirements and traffic patterns. If a 3–5 minute cold-start is not an option, keep minReplicaCount: 1 to maintain a warm GPU node at all times — at the cost of continuous billing for the idle node.
Cold-start timeline🔗
This timeline applies when a new GPU node must be provisioned — either via the KEDA HTTP Add-on triggering 0→1, or via the Prometheus trigger firing when an existing pod detects queue saturation (1→N):
- Scale event triggers (HTTP Add-on: first request intercepted; Prometheus: queue > threshold) → KEDA scales Deployment replicas up by 1
- Kubernetes creates a pending pod → Cluster Autoscaler provisions a new GPU node (~90 s on OVH)
- GPU Operator Device Plugin registers
nvidia.com/gpuon the new node (~30 s) - vLLM pod is scheduled and starts → loads model from PVC cache (~30–90 s depending on model size)
- Readiness probe passes → pod enters service
Total: 3–5 minutes for a new GPU node to become available. Communicate this to users or implement a client-side retry with exponential backoff.
HTTP clients with a default 30-second timeout will fail during the cold-start window. Set your client timeout to at least 360 seconds, or implement retry logic.
The vLLM Deployment spec sets progressDeadlineSeconds: 3600 to match the worst-case provisioning time. Kubernetes’ default deadline of 600 seconds would mark the Deployment as failed before the GPU node is ready — without this override, kubectl rollout status would return an error even though the node is still coming up.
Alerting🔗
Add a Prometheus alert for TTFT regression and KV cache saturation:
# Add to a PrometheusRule resource in the monitoring namespace
groups:
  - name: vllm
    rules:
      - alert: VllmHighTTFT
        expr: >
          histogram_quantile(0.95,
            sum(rate(vllm:time_to_first_token_seconds_bucket{namespace="vllm"}[5m])) by (le)
          ) > 5
        for: 2m
        labels:
          severity: warning
        annotations:
          summary: "vLLM p95 TTFT above 5s"
          description: "p95 time-to-first-token is {{ $value | humanizeDuration }}. Consider scaling up or switching to a quantized model."

      - alert: VllmKvCacheHigh
        expr: vllm:gpu_cache_usage_perc{namespace="vllm"} > 0.9
        for: 5m
        labels:
          severity: warning
        annotations:
          summary: "vLLM KV cache above 90%"
          description: "KV cache is at {{ $value | humanizePercentage }}. Reduce max_model_len or add a replica."
Verify the full stack🔗
# Prometheus is scraping vLLM
kubectl port-forward -n monitoring svc/prometheus-kube-prometheus-prometheus 9090:9090
# Open http://localhost:9090 → query: vllm:num_requests_running

# KEDA ScaledObject is active
kubectl get scaledobject -n vllm
# NAME           SCALETARGETKIND      SCALETARGETNAME  MIN  MAX  TRIGGERS     READY  ACTIVE
# vllm-scaler    apps/Deployment      vllm             0    2    prometheus   True   False

# Send some requests and watch the queue
watch -n2 "kubectl get pods -n vllm"

# After cooldownPeriod (5 min idle), deployment scales to 0
kubectl get deployment -n vllm
# NAME   READY   UP-TO-DATE   AVAILABLE
# vllm   0/0     0            0

# GPU node is removed by Cluster Autoscaler (~10 min after scale-to-zero)
kubectl get nodesSummary🔗
So far, the series has deployed the core self-hosted LLM inference stack on OVH Public Cloud:
| What | How |
|---|---|
| Infrastructure | Terraform: MKS cluster + CPU pool + GPU pool (RTX5000-28) |
| Deployment | Ansible: 7 roles (istio → cert_manager → gpu_operator → prometheus → vllm → keda → routes) |
| Inference | vLLM v0.21.0, OpenAI-compatible API, LLaMA 3.1 8B AWQ-INT4 |
| Ingress | Istio Gateway API + Bearer token auth + Let’s Encrypt TLS |
| Observability | kube-prometheus-stack + DCGM Exporter + Grafana dashboard |
| Autoscaling | KEDA scale-down-to-zero; scale-up via HTTP Add-on (beta) or minReplicaCount: 1 |
| Cost | GPU node can be released when idle; true 0→1 needs HTTP Add-on or a warm replica |
All source code is in the companion repository at codeberg.org/nis-aleks/ovh-llm-inference.
Related reading:
- SigNoz on OVH MKS: Infrastructure — same Terraform + Ansible pattern, full observability stack
- Self-hosted Log Archiving: ES / OpenSearch / Loki / Quickwit / ClickHouse — log storage for LLM request logs
Series
LLM Inference on OVH MKSIndex and reading guide for a six-part series on self-hosting LLM inference on OVH MKS — vLLM, GPU node pools, Terraform, observability, clients, and a gateway.
When to self-host an LLM on Kubernetes, why vLLM, and what the stack looks like on OVH MKS. Covers use cases, cost framing, and architecture. Part 1 of 6.
Provision an OVH MKS GPU node pool with Terraform, deploy vLLM, Istio, and cert-manager with Ansible, and walk through a first deployment. Part 2 of 6.
Which models fit on a 16 GB GPU, why AWQ is required for 7B+ models on the RTX5000-28, and how to use the OpenAI-compatible API from Python. Part 3 of 6.
Scrape vLLM and DCGM metrics with kube-prometheus-stack, visualise TTFT and tokens/s in Grafana, and autoscale to zero with KEDA. Part 4 of 6.
Connect Continue.dev, Zed, Cline, Open WebUI, and ownCloud Infinite Scale to a self-hosted vLLM endpoint on OVH MKS. Per-client setup guide. Part 5 of 6.
LiteLLM gateway on top of vLLM: per-user API keys, budget limits, and automatic fallback to commercial APIs when the local GPU node is cold. Part 6 of 6.