K8s & OpenShift: Resource Management
Table of contents
Part 2 covered the workload contract — probes, security context, graceful shutdown. This part goes one level lower: how the Linux kernel enforces the resource boundaries you declare in your YAML, what happens when a container hits those boundaries, and why misconfigurations here are the single most common source of both cloud waste and production incidents.
Series navigation:
- Full guide: The Kubernetes & OpenShift Best Practices Guide (2026 Edition)
- Part 1 — The Big Picture
- Part 2 — Building workloads right
- Part 3 — Resource management deep dive (this post)
- Part 4 — Scaling & resilience
- Part 5 — Security
- Part 6 — Day-2 operations & GitOps
- Part 7 — Compliance (regulatory frameworks, audit logging, log retention)
Why resource management is a business problem🔗
Workloads without resource requests and limits are the single most reliable way to overpay for cloud infrastructure and underperform in production — at the same time.
Without requests, the scheduler places pods on nodes without knowing how much capacity they actually consume. Nodes become overloaded and start evicting pods at the worst possible moment. Without limits, a single misbehaving workload can starve every other pod on the node. Both failure modes are invisible until they cause an incident.
Over-provisioning is the other side of the same problem. Teams that do not measure actual consumption set generous limits “just in case” and pay for idle capacity indefinitely. On managed Kubernetes clusters billed by node size, this translates directly to money.
Getting resource configuration right is the foundation of both stability and cost control. It is also one of the areas where the defaults are most misleading.
ResourceQuota — the project’s resource boundary🔗
Before looking at how an individual container’s requests and limits work, it helps to see the outer boundary they operate inside. A ResourceQuota caps the total resources that all pods in a namespace may consume. It is the mechanism for multi-tenancy and for preventing a single team or application from consuming the entire cluster.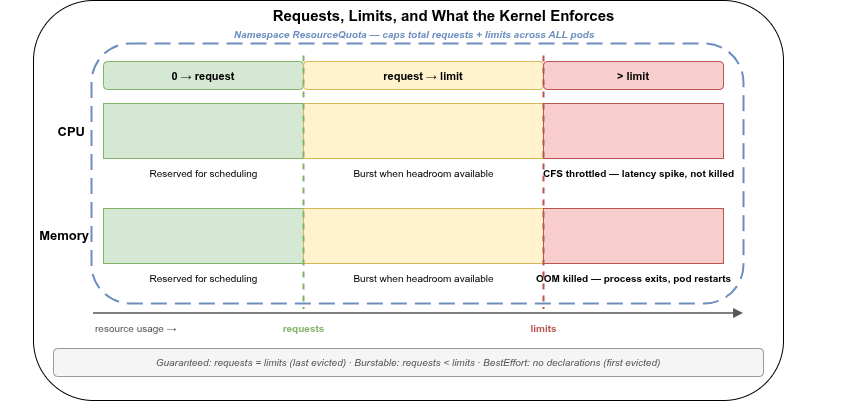
apiVersion: v1
kind: ResourceQuota
metadata:
  name: namespace-quota
  namespace: myapp
spec:
  hard:
    requests.cpu: "8"
    requests.memory: "16Gi"
    limits.cpu: "16"
    limits.memory: "32Gi"
    pods: "50"
When a ResourceQuota is present in a namespace and requires all pods to have resource requests set, pods without requests will be rejected at admission. This is a useful forcing function for teams that have not yet set resource declarations — the deployment simply fails with a clear error rather than silently running as BestEffort.
OpenShift wraps each namespace in a Project object, and the console and oc CLI commonly refer to a namespace’s ResourceQuota as its “project quota”. The object and its spec.hard fields are identical to vanilla Kubernetes. OpenShift adds one extension: ClusterResourceQuota, which applies a single quota across multiple projects matched by a label selector or annotation — useful when quota needs to be enforced per team rather than per individual project.
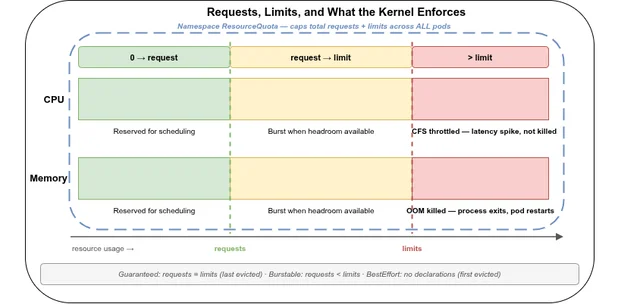
Requests and limits — the fundamental distinction🔗
Kubernetes uses two separate resource declarations, and they are not interchangeable:
Request (resources.requests) — the amount the scheduler reserves for this container when choosing a node. It does not guarantee that the container always gets this much, but it does guarantee the node has enough capacity to honour it. The kubelet also uses requests to calculate QoS class and eviction priority.
Limit (resources.limits) — the hard ceiling enforced by the Linux kernel via cgroups. The container cannot exceed this, regardless of how much capacity is available on the node.
resources:
  requests:
    cpu: "250m"
    memory: "256Mi"
  limits:
    cpu: "500m"
    memory: "512Mi"
The two declarations are independent. A limit without a request causes Kubernetes to treat the request as equal to the limit. A request without a limit means the container can consume up to the node’s full capacity — and will not be stopped.
CPU — compressible, throttled, never killed🔗
CPU is a compressible resource. When a container exceeds its CPU limit, the kernel throttles it — it gets less time on the CPU. The process is not killed. It slows down.
How the kernel enforces CPU limits🔗
Kubernetes translates CPU requests and limits into two kernel parameters of the Completely Fair Scheduler (CFS):
cpu.shares— set fromrequests.cpu; determines the container’s relative share of CPU time when the node is under contentioncfs_quota_usandcfs_period_us— set fromlimits.cpu; hard-cap the CPU time the container may use within each scheduling period (100 ms by default)
A container with limits.cpu: 500m can use at most 50 ms of CPU time per 100 ms period. If it tries to use more, the scheduler suspends it for the remainder of the period. This is throttling.
CPU throttling is silent🔗
Throttling does not appear in pod logs. The pod shows Running. The application continues to work. What changes is latency — requests take longer, timeouts occur, health probes start failing under load.
The metric to watch is container_cpu_throttled_seconds_total (or container_cpu_cfs_throttled_periods_total in some exporters). A throttle ratio above ≈20% is a signal to investigate — either the limit is too low for the actual workload, or the application has a CPU burst pattern that the flat limit does not accommodate.
For latency-sensitive workloads — APIs, databases, anything with tight response-time requirements — CPU limits can cause latency spikes that look like application bugs. The container is ready, the process is alive, but responses arrive late because the scheduler suspended the container mid-computation.
Option 1 — no CPU limit. Setting cpu.requests without setting cpu.limits is a deliberate choice: the container can burst to full node CPU capacity when available, and the scheduler still places it correctly based on the request. The tradeoff is that a noisy neighbour can starve other pods if the node is overloaded.
Option 2 — exclusive core pinning. Where the platform allows configuring the kubelet, enabling the static CPU Manager policy (cpuManagerPolicy: static) removes throttling entirely rather than just reducing its likelihood. For a Guaranteed-QoS pod (requests == limits, whole-number CPU count — QoS classes are covered later in this part) with an integer CPU value, the kubelet assigns exclusive physical cores via the cpuset cgroup and skips CFS quota enforcement for that container altogether. The tradeoff is that the reserved cores are unavailable to any other pod, whether the workload is using them or not — so this only pays off for a small number of genuinely latency-critical workloads, not as a cluster-wide default.
Evaluate by workload type.
Enabling the static CPU Manager policy requires changing kubelet configuration on the node. OpenShift supports this natively through a KubeletConfig custom resource, applied by the Machine Config Operator to a selected set of nodes. OVH MKS exposes exactly one kubelet flag — protect-kernel-defaults, a hardening setting unrelated to scheduling — and nothing else; STACKIT SKE’s node pool settings are limited to machine type, OS, and node count. Neither platform exposes cpuManagerPolicy. Exclusive core pinning is therefore an OpenShift-specific option in this series; on OVH MKS or STACKIT SKE, Option 1 (no CPU limit) is the only lever available for latency-sensitive workloads.
CPU units🔗
CPU is measured in cores and millicores (m). 1000m equals one full core. Fractional cores are common: 250m is a quarter core, 100m is a tenth. There is no lower practical bound, but anything below 10m is unusual and often a misconfiguration.
Memory — incompressible, OOM-killed🔗
Memory is an incompressible resource. When a container tries to allocate more memory than its limit allows, the Linux kernel’s OOM (Out-Of-Memory) killer steps in and terminates the process. The pod restarts, and the restart is counted — visible in kubectl get pods as a non-zero restart count and in the OOMKilled termination reason.
$ kubectl -n myapp get pods
NAME                   READY   STATUS    RESTARTS   AGE
myapp-d9f7c4b9-xk2rp   1/1     Running   3          2h
A restart count above zero on a production workload is worth investigating. Three restarts in two hours on a stateless service may be harmless; three restarts on a database sidecar is almost certainly data corruption in progress.
OOM score — who gets killed first🔗
When the node itself runs out of memory (not a container limit, but the actual node), the kernel OOM killer chooses a victim. Kubernetes influences this choice by setting oom_score_adj on each container process based on the pod’s QoS class. The container with the highest OOM score is killed first. QoS classes are covered in the next section.
Memory sizing🔗
Set the memory limit above the application’s actual working set — including peak usage under realistic load, not just idle consumption. Java heaps, Go GC pressure, and in-memory caches all consume memory that only shows up under traffic.
Under-sizing the memory limit causes OOMKill loops. Over-sizing wastes money and reduces the scheduler’s ability to pack workloads efficiently.
Old JVMs (before JDK 8u191) read available memory from /proc/meminfo, which reflects the node’s total memory — not the container’s limit. A JVM with -Xmx unset on a 64 GB node would claim 16 GB heap, immediately exceed the container limit, and OOMKill. Modern JVMs (JDK 11+, JDK 8u191+) use UseContainerSupport by default and correctly read the cgroup memory limit. Verify that your JVM version has this fix, or set -Xmx explicitly to a value below the container limit.
cgroups v1 vs cgroups v2🔗
cgroups (control groups) is the Linux kernel feature that enforces resource limits on processes. Kubernetes uses it to implement everything discussed in this post. Understanding the difference between v1 and v2 matters because the two versions behave differently in ways that affect observability, memory accounting, and OOM behavior.
cgroups v1🔗
v1 organises resource control in separate, independent hierarchies — one per subsystem. The CPU hierarchy is separate from the memory hierarchy. Each container has a cgroup in each hierarchy. The subsystems do not coordinate directly.
v1 was the default on most Linux distributions for years after its 2007 introduction. As of 2026 v2 is the default on current distributions (Ubuntu 22.04+, RHEL 9+, Debian 11+) and on the major managed providers — but a shrinking, still non-trivial share of clusters on older node images continues to run v1, which is why both models are worth understanding.
cgroups v2🔗
v2 replaces the separate hierarchies with a single unified hierarchy. All resource controllers attach to the same cgroup tree. This brings two improvements that matter in practice:
memory.oom.group— in v2, an entire cgroup group (a pod, in Kubernetes terms) can be designated as an OOM unit. When any container in the pod triggers the OOM killer, the entire pod’s processes are killed as a group rather than individual containers — leading to a clean pod restart rather than a partially-functioning pod in an inconsistent state.- Better resource accounting — v2 fixes several long-standing quirks in how page cache and shared memory are attributed, making memory usage reports more accurate.
v2 requires a kernel of 4.5+ for basic support and 5.8+ for full feature parity. Modern distributions — Ubuntu 22.04+, RHEL 9+, Debian 11+ — enable v2 by default. Kubernetes 1.25+ uses v2 on nodes where it is available.
stat -fc %T /sys/fs/cgroupOutput cgroup2fs means v2. Output tmpfs means v1. On managed clusters (EKS, AKS, GKE, OVH MKS, STACKIT SKE) the node OS determines which version is active — check the node image version or the provider’s documentation.
OpenShift 4.14+ defaults to cgroup v2 on new clusters. Existing clusters upgraded from earlier versions may still run v1. The OpenShift admin console and oc describe node show the cgroup driver in use under the Node Conditions and capacity sections.
Quality of Service classes🔗
Kubernetes assigns every pod to one of three QoS classes based on how its resource requests and limits are configured. The class determines eviction priority and OOM score.
| Class | Condition | OOM score | Eviction priority |
|---|---|---|---|
| Guaranteed | All containers have requests == limits for CPU and memory | Lowest | Last |
| Burstable | At least one container has requests, and requests ≠ limits | Medium | Second |
| BestEffort | No container has any requests or limits | Highest | First |
$ kubectl -n myapp get pod myapp-d9f7c4b9-xk2rp -o jsonpath='{.status.qosClass}'
Burstable
Guaranteed — protected, predictable, expensive🔗
A pod is Guaranteed when every container in it has both requests and limits set, and the two values are equal for both CPU and memory:
resources:
  requests:
    cpu: "500m"
    memory: "512Mi"
  limits:
    cpu: "500m"
    memory: "512Mi"
Guaranteed pods are the last to be evicted when a node is under memory pressure and have the lowest OOM score — so they are the last choice for the OOM killer when the node itself runs low. The tradeoff is that the pod cannot burst beyond its declared limits and the capacity is fully reserved.
Guaranteed is the right class for latency-sensitive or stateful workloads where unpredictable performance is worse than reserved capacity.
Burstable — flexible, common, evictable under pressure🔗
A pod is Burstable when at least one container has a CPU or memory request set, and either the limits differ from requests or limits are absent. This is the most common class in practice — it allows pods to burst above their reserved capacity when the node has headroom, while still giving the scheduler meaningful placement information.
resources:
  requests:
    cpu: "250m"
    memory: "256Mi"
  limits:
    cpu: "1000m"
    memory: "1Gi"
Under node memory pressure, Burstable pods are evicted before Guaranteed pods. Within Burstable, the pods consuming the most memory relative to their requests are evicted first.
BestEffort — no guarantees, no protection🔗
A pod with no resource declarations at all is BestEffort. It gets CPU time only when no other pod needs it, and it is the first target of the OOM killer when the node runs low on memory.
Not suitable for production workloads. BestEffort is appropriate only for workloads that can be killed and restarted at any time without consequence — batch jobs processing idempotent tasks, development-only pods. It has no place in a production namespace.
If no LimitRange is configured for a namespace, every pod without explicit resource declarations is classified as BestEffort. This is the default and it is dangerous at scale. A single node memory spike can cause a cascade of BestEffort evictions, including workloads that were implicitly relying on the available headroom. Set a LimitRange in every production namespace to ensure that pods without explicit declarations receive sensible defaults.
LimitRange — namespace-level defaults🔗
A LimitRange object sets default requests and limits for pods created in a namespace that do not declare their own. It also enforces minimum and maximum bounds. The Kubernetes docs have a walkthrough of the memory defaults case if you want to see the admission behaviour end to end.
apiVersion: v1
kind: LimitRange
metadata:
  name: default-limits
  namespace: myapp
spec:
  limits:
    - type: Container
      default:
        cpu: "500m"
        memory: "256Mi"
      defaultRequest:
        cpu: "100m"
        memory: "128Mi"
      max:
        cpu: "2"
        memory: "2Gi"
With this LimitRange in place, a container that declares no resources will receive cpu: 100m request and cpu: 500m limit, and memory: 128Mi request and memory: 256Mi limit. It also becomes Burstable rather than BestEffort.
Every production namespace should have a LimitRange. It prevents the BestEffort class from appearing by accident and gives new deployments a safe starting point without requiring every team to know the right values from day one.
A type: Container LimitRange evaluates and defaults every container in a pod independently — it has no concept of “the pod” as a whole. For a Deployment with a sidecar (log shipper, service mesh proxy, and similar), this creates two easy-to-miss effects:
- The defaulted footprint is invisible in the manifest. If only the main container declares resources and the sidecar does not, the sidecar silently receives the
default/defaultRequestvalues at admission. The pod’s real resource footprint — main container plus defaulted sidecar — is larger than what the Deployment YAML shows, and only visible viakubectl get pod -o yamlafter the fact. - A defaulted sidecar can downgrade the whole pod’s QoS class. Guaranteed QoS requires every container in the pod to have
requests == limits.defaultanddefaultRequestare typically different values (as in the example above:100mrequest vs.500mlimit) — so a sidecar relying on them becomes Burstable. Since a pod’s QoS class is determined by its least-guaranteed container, the entire pod drops from Guaranteed to Burstable, even if the main container was deliberately configured withrequests == limits. The eviction priority the team thought they had configured silently does not apply.
The fix is straightforward once known: give every container in a multi-container pod, including sidecars, explicit requests and limits rather than relying on namespace defaults for some of them.
Practical sizing guidance🔗
Start with measurement, not guesswork🔗
Resource requests and limits set without measurement are guesses. Guesses tend to be either too low (causing throttling or OOMKills) or too high (causing waste). The right starting point is actual consumption data.
For existing applications, check:
container_memory_working_set_bytes— actual memory used, excluding inactive pagescontainer_cpu_usage_seconds_total— CPU usage over a sliding windowcontainer_cpu_throttled_seconds_total— confirms whether the current CPU limit is too low
For new applications with no history, start with conservative requests and observe after the first deployment. Vertical Pod Autoscaler (VPA) in recommendation mode can run alongside a deployment and suggest right-sized values based on observed usage — this is covered in Part 4.
CPU: requests yes, limits with care🔗
Always set CPU requests — the scheduler needs them for placement, and the Horizontal Pod Autoscaler needs them too: it calculates CPU utilisation as current usage divided by the request, so a container without a CPU request gives the HPA nothing to scale against (see Part 4). For most applications, setting CPU limits is also appropriate to prevent a single workload from monopolising a node. For latency-sensitive workloads, consider whether the throttling a limit imposes is acceptable, and monitor container_cpu_throttled_seconds_total after setting limits.
A throttle ratio above ≈20% means the limit is constraining the workload. Either raise the limit, remove it, or investigate whether the application has inefficient CPU usage.
Memory: always set both, requests ≤ limits🔗
Always set memory requests and limits. Memory without limits means the container can grow until the node runs out — at which point arbitrary pods are evicted or killed across the node.
Set the request to the steady-state working set and the limit to the maximum acceptable peak. The gap between the two is the burst headroom. For predictable workloads (most services), setting requests equal to limits (Guaranteed class) removes a variable and makes eviction behavior deterministic.
The memory request matters for the HPA too, the same way the CPU request does: scaling on resource: memory calculates utilisation as current usage divided by the request (see Part 4). Memory-based scaling is generally less effective than CPU-based scaling, though — memory is incompressible, so adding a replica does not reduce what the existing pods already hold. A memory leak spreads across more pods instead of being scaled away, until the next OOM kill.
Avoid memory limits that are too close to the heap🔗
For JVM applications, the memory limit must be meaningfully above the -Xmx value. The JVM heap is not the only memory consumer — native memory, thread stacks, metaspace, code cache, and the JVM itself all add to the process’s resident set. A common safe margin is:
memory.limit ≈ Xmx + 20–30% overheadFor example, -Xmx1g needs roughly 1.2–1.3Gi as the container limit to avoid OOMKills from non-heap memory growth.
Next: Part 4 covers scaling and resilience — horizontal and vertical autoscaling, pod disruption budgets, topology spread, and anti-affinity.
Partly used sources — specific references for this part:
- Kubernetes resource limits and kernel cgroups — Medium (2019)
- Cgroups — Deep Dive into Resource Management in Kubernetes — Martin Heinz (2023)
- About cgroup v2 — kubernetes.io (2025)
- Configure Default Memory Requests and Limits for a Namespace — kubernetes.io
- Kubernetes Best Practices I Wish I Had Known Before — Pulumi (2025, updated 2026)
- What Are cgroups in Kubernetes? — Zesty
- Exposed APIs, Kubernetes configuration and Feature gates — OVHcloud